
( Eon Products [BM7WLP7F] Eon Products. n.d. EON Small Diameter PDB Samplers (1" & Larger Wells). https://store.eonpro.com/store/p/2174-EON-Small-Diameter-Passive-Diffusion-Sampler.aspx. ). Sample volumes vary with the length and diameter of each sampler; for example, a 1-inch diameter and 18-inch-long sampler provides approximately 230 milliliters of sample ( Eon Products [BM7WLP7F] Eon Products. n.d. EON Small Diameter PDB Samplers (1" & Larger Wells). https://store.eonpro.com/store/p/2174-EON-Small-Diameter-Passive-Diffusion-Sampler.aspx. ). The standard size PDB for a 2-inch diameter monitoring well is 1.7 inch diameter and 18 inches long (350 ml). PDB samplers are deployed on a reusable weighted polypropylene suspension tether that can be configured and provided by the PDB manufacturer to ensure repeated placement at the desired depth ( Eon Products [BM7WLP7F] Eon Products. n.d. EON Small Diameter PDB Samplers (1" & Larger Wells). https://store.eonpro.com/store/p/2174-EON-Small-Diameter-Passive-Diffusion-Sampler.aspx. ). Other tether materials can be used if they meet project DQOs.
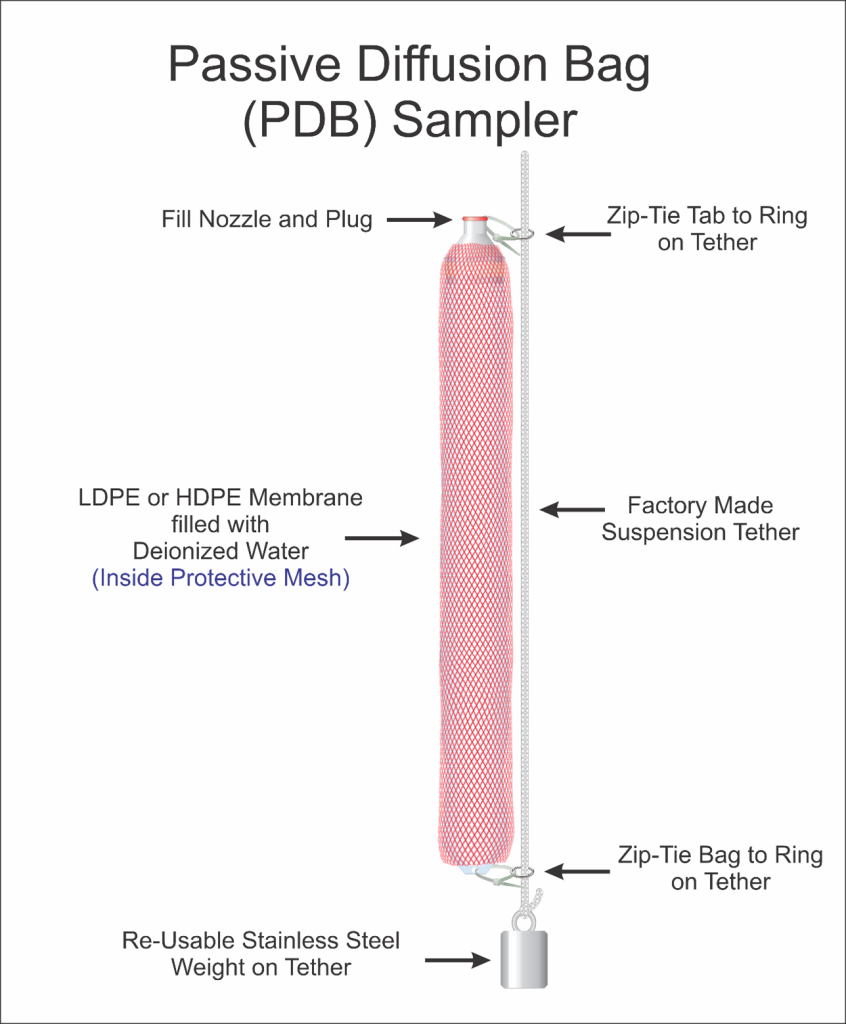
Figure 5-13. Passive diffusion bag sampler.
Source: NJDEP, figure used with permission.
5.2.1.2 Installation and Use
Operating a PDB is straightforward. To deploy the dive in monitoring wells, the PDB sampler must first be attached to a premeasured suspension tether and weight. It is then lowered to the predetermined location within the screened interval of the sampling well. For deployment in surface water or sediment (for pore water), PDB samplers are typically placed within protective canisters, which are tethered to a polypropylene or equivalent line and secured to a stationary object (for example, onshore) or to a flotation device to facilitate location and retrieval. Placement of PDBs in surface water and/or sediment should consider current and future flow and/or tides to ensure the samplers will be sufficiently inundated with water during the entire deployment period. For surface water, PDBs should be placed at the desired depth interval. Additional weights and/or lines can be used to secure the sampler at the desired interval. For sediment pore water, PDBs are deployed by manually pushing the protective canister into the sediment (if soft) to the desired depth. For coarser sediment, a trowel or shovel can be used to gently lift the sediment to allow the PDB to be inserted. Sediment should be placed back around the PDB to ensure it is completely covered by sediment. In deeper water, a push-pole device may be used to push the PDBs into the sediment, although it is recommended to use video surveillance to verify that the PDB has indeed been deployed completely. Alternatively, divers may be used to deploy the PDBs.
Equilibration times are well- and compound-dependent. The recommended minimum equilibration period for PDBs is 10–14 days, although equilibration of many VOCs may occur within 1–4 days. Additional time may be required for low-yield groundwater aquifers. The installation of the sampler can cause the water in the monitoring well to become stratigraphically mixed. To account for this, it is necessary to allot an appropriate amount of time for the chemical concentrations in the well to re-stratify and for flow to resume according to the natural conditions ( Ertel et al. 2011 [WRA2SQGD] Ertel, T., H. J. Kirchholtes, P. V. Schnakenburg, U. Schollenberger, S. Spitzberg, and W. Schäfer. 2011. “FOKS Handbook for Integral Groundwater Investigation: Toolbox for the Identification of Key Sources of Groundwater Contamination.” CENTRAL EUROPE Programme. http://projectfoks.zuova.cz/wp-content/uploads/2012/06/toolbox_for_the_identification_of_key_sources_of_groundwater_contamination.pdf. ). Samplers can be left in monitoring wells between sampling events, then removed and replaced with a new sampler to abate mobilization and augment efficiency.
Recovery is a simple matter of pulling the sampler out of the monitoring well, water column, or sediment and transferring the contents to appropriate containers, typically VOA vials. Samples can be transferred directly into sample containers by carefully cutting or slicing the PDB or using discharge “straws” to pierce the membrane. This needs to be done within minutes of removing the sample from submersion to prevent a loss of volatiles to the air. Transfer of water from the PDB to sample containers is required before shipping samples to the laboratory.
In groundwater monitoring wells, PDBs can be installed at one or more intervals in the well screen and left in place under natural flow conditions ( Belluomini et al. 2008 [HM2SQ6CJ] Belluomini, Steve, Kathleen Considine, Bill Owen, and John Woodling. 2008. “Representative Sampling of Groundwater for Hazardous Substances: Guidance Manual for Groundwater Investigations.” California Environmental Protection Agency. https://dtsc.cdev.sites.ca.gov/wp-content/uploads/sites/112/2018/09/Representative_Sampling_of_GW_for_Haz_Subst.pdf. ). Natural flow transports target chemicals in the aquifer into the well through the screen. As compared to purge and pump procedures, this technique results in significant cost savings due to less field mobilization time and reduced wastewater disposal.
PDBs also provide depth-specific profiling for compounds and concentrations. The PDBs’ ability to reflect dissolved target chemicals concentrations at a discrete depth allows the determination of stratification and vertical concentration gradients of target chemicals in groundwater. A PDB sampler should not be assumed to represent more than 5 feet of a saturated well screen unless longer intervals in a given well have been determined to be homogeneous. Interval target chemical concentrations can be measured at specific well screen depths by positioning PDB samplers in series, as shown in Figure 5-14. Hanging the samplers as such can result in the collection of information about the well’s hydrogeologic attributes and determining the correct positioning of future single PDB samplers.
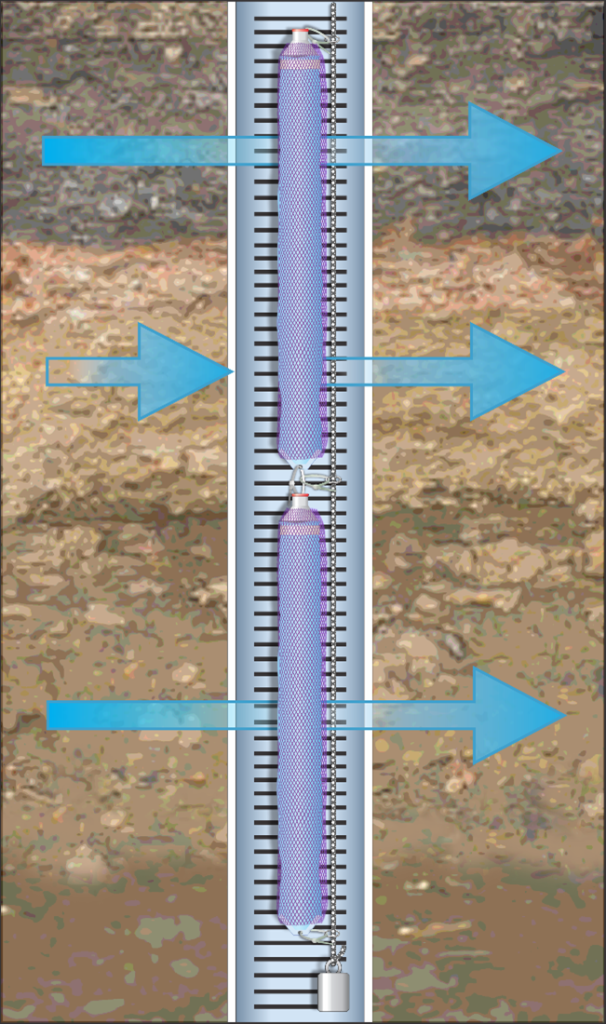
Figure 5-14. Deployment of multiple PDB samplers in a vertically profiled well.
Source: NJDEP, figure used with permission.
PDBs were initially designed to collect representative concentrations of VOCs from specific intervals in groundwater monitoring wells. In the years since they were commercially introduced, studies have also successfully used PDBs to collect representative VOC concentrations from surface water and sediment pore water. Because polyethylene-based PDBs are semipermeable, certain compounds are restricted from diffusing through the membrane. Because the semipermeable PDB membrane allows diffusion only of nonpolar VOCs, the PDB can be used during active remediation to screen out non-VOC and oxidizing agents such as potassium permanganate while allowing residual VOCs, such as tetrachloroethylene (PCE), to be collected to measure remediation progress or effectiveness.
Metals and other nonorganics are not generally sampled using a PDB sampler because they cannot diffuse through the membrane. Compounds with a molecule size less than 10 angstroms, such as nonpolar VOCs, are recommended.
5.2.1.3 Advantages
- PDB samplers have become a commonly accepted method for establishing concentrations of VOCs in groundwater monitoring wells as well as surface water and sediment pore water.
- PDBs are easy to deploy and retrieve, allowing for rapid installation and sample collection.
- Sample collection in groundwater monitoring wells does not require purging, which provides ease of use and reduced labor costs and purge water disposal costs.
- PDBs reduce matrix interference from turbidity due to the small pore size of the LDPE membrane.
- PDB samplers are commercially available and are inexpensive to purchase or construct.
- PDB samplers have been manufactured to sample groundwater monitoring wells as small as 0.75-inch inside diameter.
- The samplers can be deployed for long residence times (that is, annual or biannual sampling events).
- Samplers can collect samples from discrete intervals in groundwater monitoring wells or surface water to produce a vertical contaminant profile.
- Samples have been successfully retrieved at depths more than 700 feet bgs.
- The PDB is a disposable sampler, reducing decontamination time.
5.2.1.4 Limitations
- Because the range of chemicals that can diffuse into PDB samplers is limited, these samplers should not be used for initial investigations where the chemicals of concern have yet to be identified. PDBs should be deployed mainly at well-characterized sites where the chemicals of concern have been identified as VOC compounds.
- PDBs collect a time-weighted discrete interval sample. Once the samplers have reached the minimum residence time, the samples are representative of concentrations present near time of removal. This is advantageous in aquifers with low hydraulic conductivity where chemicals migrate slowly but is limited in capturing contaminant spikes in aquifers with high hydraulic conductivity (that is, karst aquifers).
- PDBs require a minimum equilibration time of 2 weeks, which may not be suitable for rapid response situations
5.2.2 Dual Membrane Passive Diffusion Bag Sampler (DMPDB)
5.2.2.1 Description and Application
The Dual Membrane Passive Diffusion sampler (DMPDB) (Figure 5-15) is an equilibrium-based passive diffusion sampler that has been commercially available since 2014 for monitoring aqueous media, particularly groundwater ( Eon Products [DDXS64KH] Eon Products. n.d. EON Dual Membrane Passive Diffusion Samplers (DMPDBTM). https://store.eonpro.com/eon-dual-membrane-passive-diffusion-samplers-dmpdb-2900.aspx. ). The DMPDB operates using the same diffusion principles of established PDB sampling, but it uses two different semipermeable membranes on the same sampler, allowing for the diffusion of large or polar molecules and the sampling of an expanded list of compounds and water quality parameters.
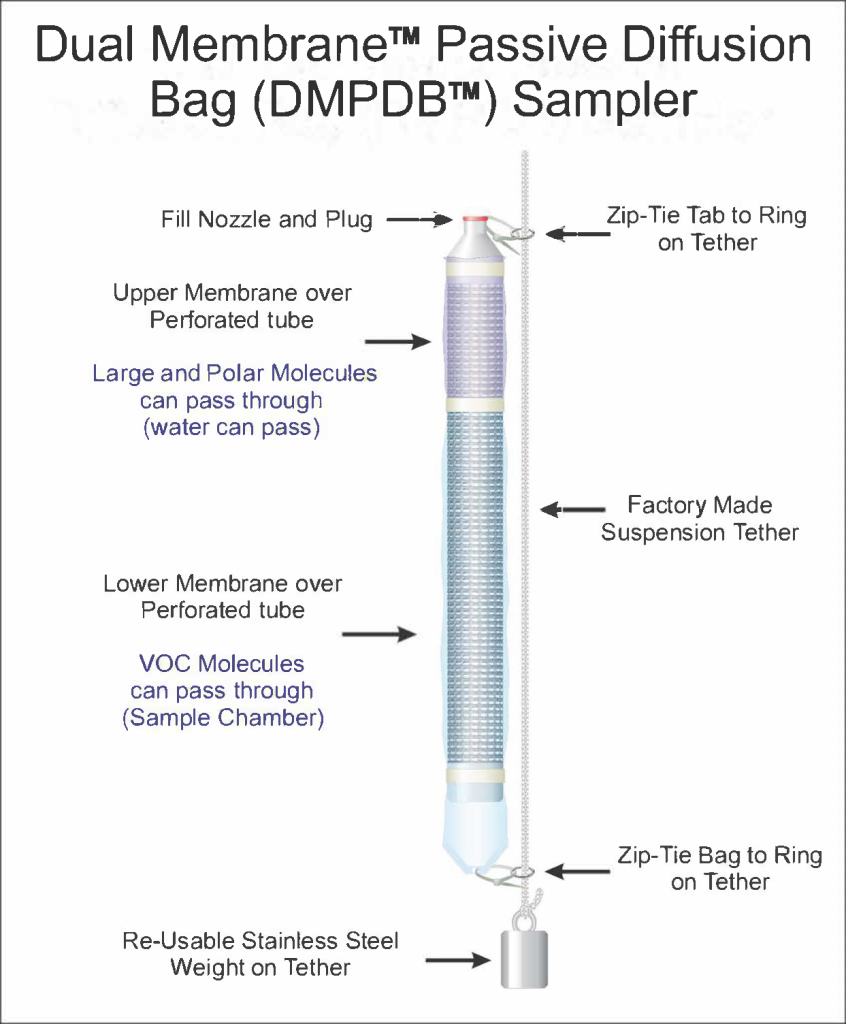
Figure 5-15. Dual membrane passive diffusion sampler.
Source: NJDEP, figure used with permission.
The DMPDB consists of two semipermeable membranes wrapped in series around a frame made of a rigid, perforated polypropylene tube (1.75″ diameter), forming a single sample reservoir. The membrane on the lower section of this tube is made of LDPE or HDPE, which allows the diffusion of VOCs. Because the polyethylene portion is hydrophobic, it does not allow water molecules to pass, forming the reservoir where the sample is held. The membrane on the upper portion of the tube is made from more porous material that allows the diffusion of large or polar molecules between the surrounding aqueous media and the DMPDB. The upper membrane of the standard DMPDB is made of hydrophilic polyamide material (150-micron (µm) pores). The upper membrane porosity allows information on field parameters (pH, dissolved oxygen, etc.) to be collected. This document primarily refers to this standard version of the DMPDB. However, custom DMPDB versions have been made with other upper membrane materials with pores as small as 18 angstroms to meet specific site or contaminant conditions.
DMPDBs may be used in sampling of aqueous environments, including but not limited to groundwater and sediment pore water. The sampling technique allows for collection of samples from turbid aqueous media where traditional sampling methods may bias sample results or produce samples that require additional laboratory steps prior to undergoing analysis. DMPDBs do not create flow that could mobilize sediments, and the sampler membranes ensure that the aqueous sample represents only an unfiltered representation of suspended particulates smaller than the membrane pores.
When using DMPDBs in groundwater, the samplers act similarly to other equilibrium-based samplers. The DMPDB is deployed into the saturated screen or fractured bedrock in groundwater monitoring wells, where it is in contact with the natural groundwater flow through the well. The disturbance created during deployment is minimal, and the sampler can be used to target a specific interval of groundwater within the well screen. In cases where contaminant stratification may be present, passive sampling via the DMPDB allows for targeted interval sampling by deploying multiple samplers on a single suspension tether at target intervals along the saturated screen. The DMPDB will provide interval-specific results without mixing that may occur during active purging or low-flow pumping.
The DMPDB may be deployed in sediment for sampling of pore water through installation of a screened canister. Canisters should be installed to ensure the DMPDB remains submerged for the entirety of the equilibration period and should be flagged and anchored to ensure they remain in place. Diffusion/deployment times may be extended on a case-by-case basis for different chemicals.
5.2.2.2 Installation and Use
The DMPDB is filled with DI water during field mobilization and lowered into the interval of interest in the well, on a weighted suspension tether, where it intercepts natural water flow. Molecules enter the DMPDB by diffusing through the membranes into the sample chamber/reservoir. Although VOCs can enter the sampler through either membrane, larger or polar molecules, including water, as well as background colloids, diffuse through the larger pores of the upper membrane. Once inside the sampler, molecules diffuse throughout the water column in the DMPDB’s reservoir until equilibrium is reached within the sampler and with the surrounding aqueous media. The recommended minimum residence time for the DMPDB to reach equilibrium and provide a representative sample is 21 days, which includes time for the surrounding environment to restabilize and return to natural flow conditions after being disturbed by sampler placement, as well as time for individual contaminant molecules to come to equilibrium within the DMPDB. Actual diffusion time (excluding surrounding area restabilization) ranges from approximately 1 day to 2 weeks, depending on the diffusion coefficients of the molecules of each contaminant of concern. Once the minimum residence time is met, the samplers can be left in place indefinitely and will represent the time-weighted average concentrations of the time surrounding retrieval. Some compounds, such as PFAS and 1,4-dioxane, equilibrate within about a week after well stabilization. Others, such as most SVOCs, will take longer. There is no standard maximum residence time for sample accuracy, because the diffusion process keeps the samplers in a dynamic equilibrium with the surrounding water, and the DMPDB materials are all chemically resistant to typical chemicals found in aqueous environments. Site-specific conditions may warrant a maximum residence time for deployment.
When the DMPDB is retrieved from the well or other casing, water in the upper portion of the sampler flows out through the pores in the upper membrane as the sampler exits the water column, leaving the equilibrated sample in the lower reservoir. The polyethylene sample chamber of the DMPDB is then punctured with a “juice box”–like straw, and the sample is discharged through the straw directly into laboratory-provided sample containers. Because there is no maximum deployment time for the DMPDB, it is common practice at many sites to replace the DMPDB being sampled at the current event with the sampler for the next event.
Compound-specific information:
- Can be used for all VOCs, similar to previous standard PDB technology
- Cations, anions, metals (dissolved and total), nitrate/nitrite, SVOCs
- Emerging contaminants: 1,4-dioxane and PFAS
Data from DMPDB use for a variety of compounds and water quality parameters are steadily increasing over time as more side-by-side field and case studies are conducted. For the most up-to-date information on studies and sampler capabilities, contact the manufacturer.
Individual DMPDB sample volume varies by the sampler diameter and length selected to fit the available saturated screen. DMPDBs are approximately 1.7 inches in diameter to fit 2-inch schedule 40 and larger wells and are available in standard lengths of 16 inches (250+ ml), 24 inches (500+ ml), 28 inches (650+ ml), 31 inches (750+ ml), and 40 inches (1+ L). Custom sizes are available. A single DMPDB can acquire greater than 1 liter of sample from a 2-inch monitoring well with 5 feet of saturated screen. Multiple DMPDBs can be attached to the same suspension tether to add sample volume or to sample discrete intervals in wells with longer saturated screens. Custom installation configuration is required for 2-inch schedule 80 wells.
5.2.2.3 Advantages
- DMPDBs are effective for sampling a multitude of chemicals in groundwater, including VOCs, some SVOCs, trace metals, anions, cations, and contaminants of emerging concern, including 1,4-dioxane and PFAS, according to lab and/or field studies.
- They allow consistency in collection depth over repeated sampling events due to predetermined sample location (tether for groundwater or sampler housing for other media).
- They allow for easier vertical profiling to investigate stratified contaminant zones, multiple well screens, and bedrock fracture zones using discrete predetermined sample depths.
- DMPDBs allows the collection of field parameters, including dissolved oxygen, pH, and temperature, due to upper membrane design.
- They are constructed of nonbiodegradable materials, allowing the sampler to remain in place for extended time periods.
- DMPDB samples will include representative background colloids/suspended solids, without contributing additional, method-induced turbidity. Filtration practices should be followed if required for specific project and/or lab analysis.
- DMPDBs reduce cross-contamination risk because samplers are single use and are deployed using systems dedicated to sample locations (for example, tethers or sediment canisters).
- They eliminate or substantially decrease the generation of IDW.
- Sampling apparatus (tether, sediment canister, etc.) is reusable with only the sampler replaced for each sampling event and eliminates the use of gasoline or battery-powered sources often required by pumps. Although the DMPDB itself is single use, it has a smaller material footprint than most single-use bailers and tubing used for groundwater monitoring.
- When retrieved for sampling, they can be immediately replaced with a new DMPDB on the designated tether and can reside in place until the next sampling event, decreasing labor costs associated with sample collection activities.
5.2.2.4 Limitations
- DMPDBs provide limited sample volume, requiring consideration of laboratory sample volume requirements.
- The standard version requires field personnel to fill sampler with DI water in the field. Due to the hydrophilic polyamide upper membrane, the sampler cannot be transported prefilled and must be handled and deployed upright once filled to prevent spilling.
- They are restricted by monitoring well or sampler housing construction, requiring an inside diameter of at least 2 inches or larger to avoid abrasions if obstructions or rough edges are encountered.
- DMPDBs require extended deployment time of 2–3 weeks for equilibration of some chemicals both into and within the sampler, depending on the type of contaminant and well recharge rates. Investigations requiring shorter sampling frequencies may not be feasible.
- The standard version does not collect a “dissolved-only” sample. Use of a custom upper membrane may provide a dissolved-only sample.
- Prior to using in environments with exceptionally high solvent concentrations, contact the manufacturer to discuss options for maintaining integrity of sampler materials.
- DMPDBs should be deoxygenated (both the receiving media and sampler body if PTFE or polycarbonate) to reduce introduction of oxygen into potentially reducing environments, especially for relatively short deployment times.
5.2.3 Nylon Screen Passive Diffusion Sampler (NSPDS)
5.2.3.1 Description and Application
The nylon screen passive diffusion sampler (NSPDS) (Figure 5-16) is a passive equilibrium sampler for surface and groundwater. NSPDSs were developed to sample for a broader array of analytes than the PDB sampler ( Belluomini et al. 2008 [HM2SQ6CJ] Belluomini, Steve, Kathleen Considine, Bill Owen, and John Woodling. 2008. “Representative Sampling of Groundwater for Hazardous Substances: Guidance Manual for Groundwater Investigations.” California Environmental Protection Agency. https://dtsc.cdev.sites.ca.gov/wp-content/uploads/sites/112/2018/09/Representative_Sampling_of_GW_for_Haz_Subst.pdf. ). The NSPDS is constructed using polypropylene wide-mouth bottles, a ring style cap, and a square of nylon mesh screen with a typical pore size of 125–250 μm.
The bottles are filled with the appropriate type of DI water based on the project goals. A sheet of nylon screen is placed over the mouth, and the cap is screwed on. The sample bottle can be deployed alone or can be stacked in a polyethylene mesh bag. The number of bottles is dependent on the required sample volume for the project.
NSPDSs operate using the principles of molecular diffusion across the nylon screen mesh. The NSPDS bottles are filled with analyte-free DI water prior to installation. Therefore, a concentration gradient exists between the compounds in the target aqueous media (groundwater, surface water, or pore water) and the interior of the NSPDS bottles. Compounds diffuse through the nylon screen mesh until the concentration between the target media and the water in the sampler equilibrates. The NSPDS maintains dynamic equilibrium so that if chemical concentrations in the target media change, the concentrations in the sampler will adjust accordingly. Diffusion rates vary by compound, so the sample in the NSPDS bottles typically represents the concentrations in the target media over the last several days prior to removal.
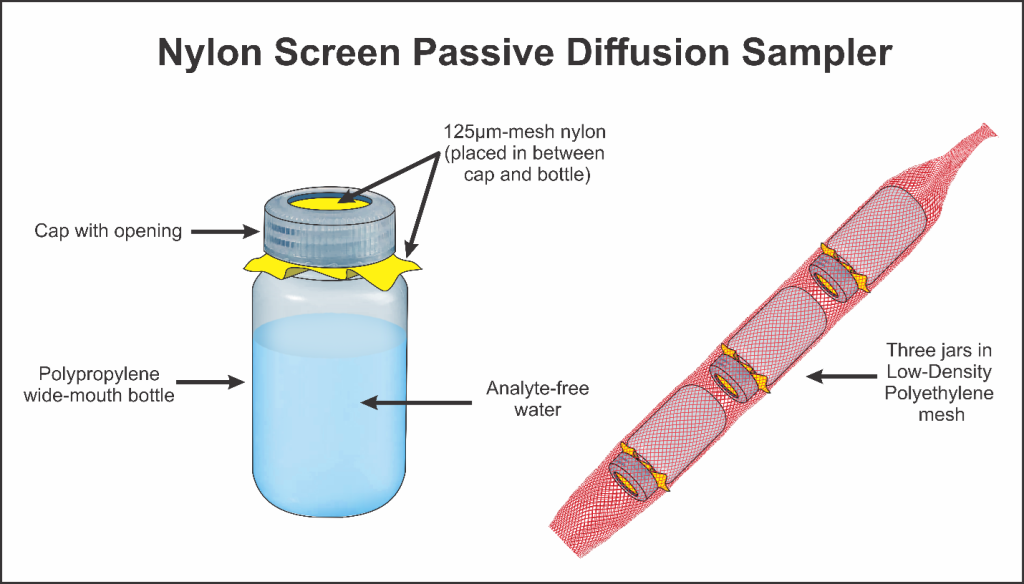
Figure 5-16. Nylon screen passive diffusion sampler.
Source: NJDEP, figure used with permission.
5.2.3.2 Installation and Use
For deployment in wells, the NSPD samplers are placed inside a mesh liner, which is attached to the hanging line with zip ties. The samplers can be arranged in stacks depending on the volume of water needed for analyses. The micron nylon mesh of the bottle(s) should be faced downward to minimize mixing of water in the samplers with shallower well water during recovery ( Vroblesky et al. 2002 [47IYEXTP] Vroblesky, Don A., Matthew D. Petkewich, and Ted R. Campbell. 2002. Field Tests of Diffusion Samplers for Inorganic Constituents in Wells and at a Ground-Water-Discharge Zone. Water-Resources Investigations Report Nos. 02–4031. U.S. Geological Survey. https://pubs.usgs.gov/wri/wri024031/pdf/wrir02-4031.pdf. ). If the micron nylon mesh is not facing downward, it is possible that stagnant water from the casing or chemically different water from above the sample interval may be incorporated into the sample through the mesh as the bottle is pulled upward through the screen and casing. Care should be taken so that bottles do not block each other when the samplers are used in series. When the sampler is not submerged, it retains the water as a result of surface tension (between the water and the screen) and the vacuum that develops in the inverted bottle ( Imbrigiotta and Harte 2020 [9LSVPE48] Imbrigiotta, Thomas, and Philip Harte. 2020. “Passive Sampling of Groundwater Wells for Determination of Water Chemistry.” In U.S. Geological Survey Techniques and Methods. https://doi.org/10.3133/tm1d8. ). Over time, chemicals diffuse across the nylon screen and equilibrate with the water inside the sampler. After retrieval, the sampled media must be prepared to be sent to the laboratory for analysis by either. The content of the sampler is transferring from the sampled media to laboratory sample containers, and sent to the lab for analysis, or the cut out cap on the sampler that holds the screen is replaced with blank caps, and the sampler bottles are sent for analysis
The direction the bottles are facing within the well can also affect their function ( Vroblesky et al. 2002 [47IYEXTP] Vroblesky, Don A., Matthew D. Petkewich, and Ted R. Campbell. 2002. Field Tests of Diffusion Samplers for Inorganic Constituents in Wells and at a Ground-Water-Discharge Zone. Water-Resources Investigations Report Nos. 02–4031. U.S. Geological Survey. https://pubs.usgs.gov/wri/wri024031/pdf/wrir02-4031.pdf. ). As seen by the work from Webster, Teasdale, and Grigg. ( Webster et al. 1998 [L4CH5QFU] Webster, I. T., P. R. Teasdale, and N. Grigg. 1998. “Theoretical and Experimental Analysis of Peeper Equilibration Dynamics.” Environmental Science and Technology 32: 1727–33. ), samplers facing down in water with a high ionic strength are unsuccessful in equilibrating as a result of density differences between the sampler and ambient water ( Vroblesky et al. 2002 [47IYEXTP] Vroblesky, Don A., Matthew D. Petkewich, and Ted R. Campbell. 2002. Field Tests of Diffusion Samplers for Inorganic Constituents in Wells and at a Ground-Water-Discharge Zone. Water-Resources Investigations Report Nos. 02–4031. U.S. Geological Survey. https://pubs.usgs.gov/wri/wri024031/pdf/wrir02-4031.pdf. ). It is ideal to orient the sampler so that the sampler membrane faces the well screen. According to Vroblesky, Petkewich, and Campbell ( Vroblesky et al. 2002 [47IYEXTP] Vroblesky, Don A., Matthew D. Petkewich, and Ted R. Campbell. 2002. Field Tests of Diffusion Samplers for Inorganic Constituents in Wells and at a Ground-Water-Discharge Zone. Water-Resources Investigations Report Nos. 02–4031. U.S. Geological Survey. https://pubs.usgs.gov/wri/wri024031/pdf/wrir02-4031.pdf. ), bottles should be oriented downward in wells with 2-inch diameters where horizontal deployment is not possible and the water is not strongly ionic. The stated purpose of this orientation was to minimize mixing of water in the samplers with shallower well water during sampler recovery ( Vroblesky et al. 2002 [47IYEXTP] Vroblesky, Don A., Matthew D. Petkewich, and Ted R. Campbell. 2002. Field Tests of Diffusion Samplers for Inorganic Constituents in Wells and at a Ground-Water-Discharge Zone. Water-Resources Investigations Report Nos. 02–4031. U.S. Geological Survey. https://pubs.usgs.gov/wri/wri024031/pdf/wrir02-4031.pdf. ). In addition, NSPDS placed with the screen mesh facing upward in groundwater may risk infiltration of water from above the sampling position, possibly water from the casing, as the samplers are pulled upward during the recovery process.
In January 2003 Columbia Analytical Services, in cooperation with criteria developed by Vroblesky of the USGS, conducted equilibration studies for NSPDS and included VOCs such as benzene, tetrachloroethene (PCE), trichloroethene (TCE), and 1,4-dioxane, as well as inorganic chemicals such as perchlorate, chloride, arsenic, and iron ( Vroblesky et al. 2003 [RU727V73] Vroblesky, D., W. Scheible, and G. Teall. 2003. “Laboratory Equilibration Study of Nylon-Screen Passive Diffusion Samplers for VOCs, and Select Inorganics.” ITRC Spring Meeting (Annapolis MD). ). All chemicals exhibited excellent diffusion from the test jars into the sampler water and equilibration was generally achieved in 24 hours. Further studies were conducted by Columbia Analytical Services in April 2003 on a suite of metals, and again, with the exception of silver, the NSPDS showed good transfer from test jars into sampler water ( Vroblesky et al. 2003 [RU727V73] Vroblesky, D., W. Scheible, and G. Teall. 2003. “Laboratory Equilibration Study of Nylon-Screen Passive Diffusion Samplers for VOCs, and Select Inorganics.” ITRC Spring Meeting (Annapolis MD). ). Subsequent studies by Columbia in August 2003 with samplers more suitable for 2-inch diameter wells (30- and 60-mL bottles with heights of about 60 mm and volume of up to 175 mL) showed poor comparisons with water in test jars ( Vroblesky et al. 2003 [RU727V73] Vroblesky, D., W. Scheible, and G. Teall. 2003. “Laboratory Equilibration Study of Nylon-Screen Passive Diffusion Samplers for VOCs, and Select Inorganics.” ITRC Spring Meeting (Annapolis MD). ). Literature searches have been unsuccessful in finding citations that reference a nylon screen sampler being used for SVOC collection ( 2020 [L84MVLPQ] Contaminated Site Clean-Up Information (CLU-IN). 2020. “Passive (No Purge) Samplers.” June 4. https://cluin.org/characterization/technologies/default.focus/sec/Passive_(no_purge)_Samplers/cat/Diffusion_Samplers/. ).
Webster, Teasdale, and Grigg ( Webster et al. 1998 [L4CH5QFU] Webster, I. T., P. R. Teasdale, and N. Grigg. 1998. “Theoretical and Experimental Analysis of Peeper Equilibration Dynamics.” Environmental Science and Technology 32: 1727–33. ) examined the influence of orientation on bottles having similar design factors (however, he used a polysulfone membrane) and found that when deployed in saline pore water, bottles oriented with the opening toward the side equilibrated significantly more quickly than bottles oriented with the opening up or down. Sampler orientation is dependent on well constriction and site-specific details ( Webster et al. 1998 [L4CH5QFU] Webster, I. T., P. R. Teasdale, and N. Grigg. 1998. “Theoretical and Experimental Analysis of Peeper Equilibration Dynamics.” Environmental Science and Technology 32: 1727–33. ).
5.2.3.3 Advantages
- NSPDSs are good for most analytes.
- They eliminate or reduce IDW.
- They do not require specialized equipment (for example, generator, compressed gases).
- They can sample at discrete intervals to prevent groundwater mixing.
- Users can stack devices to profile screen length.
- NSPDSs have a small sampling interval, which provides good profile location for identifying contaminant stratification.
- They require minimal decontamination of the sampler. A disposable device is common for similar types of other passive diffusion samplers.
5.2.3.4 Limitations
- These samplers are not commercially available. However, NSPDSs can be easily constructed with typical laboratory sampling bottles and using mesh materials from industrial suppliers.
- Limited sample volume may be a concern if using these devices to test for a wide range of chemicals.
- These samplers are better suited to larger wells, where the larger volume samplers may be used. Smaller volume jars used for 2-inch wells have shown inconsistent results.
- Sampling for reduction-oxidation (redox)-sensitive metals, such as lead, iron, and manganese, is subject to several uncertainties and should be approached with caution. When using water-filled diffusion samplers to sample redox-sensitive parameters in a well that maintains anaerobic water in the well bore, one approach to avoid oxidation and precipitation of redox-sensitive metals is to use anaerobic water as the sampler filling solution. Insufficient work has been done to determine whether prefilling with anaerobic water is effective.
- The sampler should be deoxygenated (both the receiving media and sampler body if PTFE or polycarbonate) to reduce introduction of oxygen into potentially reducing environments, especially for relatively short deployment times.
5.2.4 Peeper Sampler
5.2.4.1 Description and Application
Peeper samplers (that is, dialysis cells or Hesslein In Situ Pore Water samplers) (Figure 5-17) are rigid structures that are equipped with one or more water-filled chambers that are covered with a semipermeable membrane or mesh and rely on diffusion of chemicals from the pore water into the water-filled peeper chamber to reach equilibrium. Peeper samplers were developed for in situ monitoring of dissolved chemicals in saturated sediments ( Hesslein 1976 [TKD2SRMX] Hesslein, Raymond H. 1976. “An in Situ Sampler for Close Interval Pore Water Studies.” Limnology and Oceanography 21 (6): 912–14. https://doi.org/10.4319/lo.1976.21.6.0912. ). The efficiency of peeper samplers depends on equilibration time of the target chemical(s), which is a function of diffusion coefficient, adsorption-desorption properties, surrounding ambient-solution temperature, and sediment porosity. Peeper samplers have advantages over older centrifugation methods, including in situ monitoring of trace elements, quick and efficient sampling times, increased depth resolution, and minimal temperature and O2 (g) diffusion effects. The primary advantage of the peeper sampler is that it measures dissolved fraction, which can be compared to risk-based standards (i.e., risk-based corrective action (RBCA)) or federal/state cleanup criteria.
Peeper samplers can be stacked in a specially designed corer to sample discrete depths, direct-driven for near-surface (1–3 m) evaluation, or placed in a shallow rectangular array for near-surface area distribution determinations (Table 5-3). Prior to deployment, peepers are filled with an appropriate grade of water (for example, distilled, DI, or milli-Q) that can be spiked with a known concentration of PRC. PRCs are typically compounds that behave conservatively in the environment, meaning they do not have strong adsorption/reaction qualities, and can be used as simple tracers. Bromide is a common PRC. Addition of a PRC is useful for calculating percent equilibrium achieved between the peeper chamber and the pore water when the peeper is retrieved and sampled. Following deployment, peepers are left in place for a designated amount of time to achieve equilibrium with the surrounding pore water. Peeper equilibration time can range from hours to a month, depending on peeper construction, target chemicals, and site-specific soil/sediment properties. Peeper samplers are available commercially and are also fabricated by universities and other researchers. General and specialized peeper sampler designs are described in the following sections.
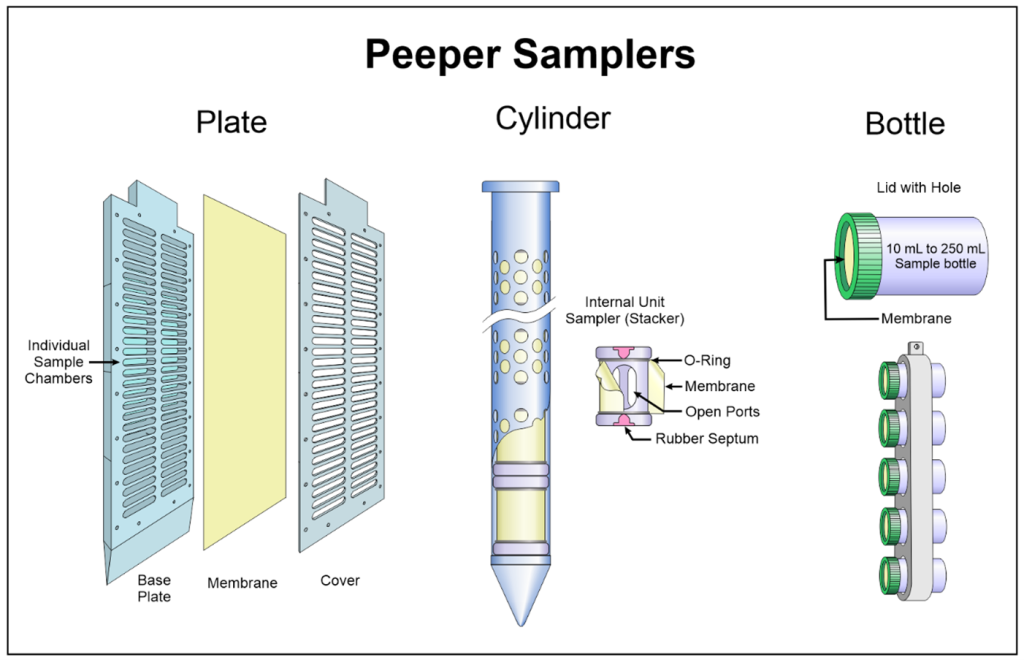
Figure 5 17. Peeper sampler, showing the three types: plate, cylinder, and bottle.
Source: NJDEP, figure used with permission.
Table 5-3. Applications of peeper samplers.
| Style | Type | Application | Installation | Chemical Constituents |
|---|---|---|---|---|
| Plate | Hesslein | shallow sediments | hand-push, slide hammer | Inorganics, VOCs, WQ parameters, (PFAS) |
| sHRPP (sediment High-Resolution Passive Profiler) | shallow sediments | hand-push, slide hammer | PFAS (McDermett et al. 2022), metals, and organics (Andrew Jackson et al. 2022) | |
| Cylinder | Standard | shallow sediments | hand-push, slide hammer | Inorganics (Risacher et al. 2023) |
| HRPP (High-Resolution Passive Profiler) | deep sediments, shallow groundwater | slide hammer, diverless push-pole, dive team, direct-push rig tooling | PFAS (McDermett et al. 2022), inorganics, VOCs, microbial community and genes, hydrophobic organic compounds | |
| Bottle | PsMS (polysulfone membrane sampler) | monitoring wells | lower using rope/cable | Metals (metalloids and some nonmetals) (Peijnenburg et al. 2014) |
| SPeeper | shallow sediments, surface water, monitoring wells | hand-push, diverless push-pole, lower using rope/cable | Metals, dissolved organic carbon, phosphorus, major anions, and WQ parameters (Vachon 2023a) |
|
| PFASsive | shallow sediments, surface water, monitoring wells | hand-push, diverless push-pole, lower using rope/cable | PFAS |
5.2.4.2 Installation and Use
Typical peeper samplers employ a rigid body with an opening or openings that are covered with a permeable membrane or mesh ( Jackson 2003 [DA6W5JRD] Jackson, A. 2003. “Peeper Samplers.” ITRC Fall Membership Meeting. ). Peeper samplers can be constructed of LEXAN, acrylic, Teflon, stainless steel, or other millable material. Material selection is a function of site-specific characteristics (for example, target depth and chemicals of interest). Due to the wide range of peeper designs and sizes, individual peeper cell volumes can vary from less than 1 mL to more than 100 mL. Common peeper sampler structures can be divided into three categories: plate, cylinder, and bottle (Figure 5-14 and Table 5-3).
- Plate peepers range from approximately 5 to 100 cm long and approximately 1 to 3 cm thick. A typical plate peeper design resembles a box corer with individual cells milled into the sampler body at approximately 1-cm transects. Plate peeper cell volume ranges from approximately 1 to 20 mL per cell, depending on cell depth and length.
- Cylinder peeper designs have outer diameters ranging from approximately 1 cm to 7 cm and can be up to 4 m long. Similar to plate peepers, individual cell volume ranges from approximately 1 to 20 mL per cell, depending on peeper diameter and cell geometry. An example of common cylinder peeper sampler construction is an acrylic cylindrical rod with holes in the side that are fitted with membrane and/or mesh material.
- A typical bottle peeper design is a glass vial or polyethylene bottle with a membrane secured to the mouth of the bottle using the bottle cap. The bottle cap is perforated or cored to expose the membrane to the pore water. Bottle peeper sample volume is dependent upon the size and number of bottles used, but typically ranges from approximately 10 mL to 250 mL. Specialized modifications of the three traditional peeper designs (plate, cylinder, and bottle) have been developed to address specific needs, such as direct-drive (vs. down-well) deployment beyond near-surface sample depths (> 5 ft bgs), or to evaluate emerging contaminants with stringent sampling protocols (for example, PFAS).
A polysulfone membrane sampler (PsMS) is a modification of the bottle peeper sampler that was first implemented as part of a field demonstration of passive groundwater sampling devices performed at McClellan Air Force Base (AFB), near Sacramento, California ( Parsons 2004 [993ENPDF] Parsons. 2004. “Final Work Plan for the Demonstration of Passive Groundwater Sampling Devices at Former McClellan Air Force Base.” ). The PsMS constructed for use in the McClellan AFB study consisted of a rigid 2-inch long, 2-inch OD section of PVC pipe covered on both ends with flexible 0.2-µm polysulfone membrane ( Parsons 2005 [IKZXKLEL] Parsons. 2005. FINAL: Results Report for the Demonstration of No-Purge Groundwater Sampling Devices at Former McClellan Air Force Base, California. Nos. F44650-9900005. https://clu-in.org/download/char/passsamp/mcclellan_final_results_report.pdf. ). The volume of each PsMS canister was approximately 108 mL ( Parsons 2005 [IKZXKLEL] Parsons. 2005. FINAL: Results Report for the Demonstration of No-Purge Groundwater Sampling Devices at Former McClellan Air Force Base, California. Nos. F44650-9900005. https://clu-in.org/download/char/passsamp/mcclellan_final_results_report.pdf. ). Two canisters are typically deployed at each sample depth to provide adequate sample volume for standard laboratory analysis. The groundwater sample is transferred from the PsMS to the appropriate sample container by puncturing the membrane with a straw and pouring the contents from the sampler into the container through the straw. Considerations regarding the orientation of peeper samplers led to the deployment of the PsMS in an orientation where the membrane is positioned horizontally ( Webster et al. 1998 [L4CH5QFU] Webster, I. T., P. R. Teasdale, and N. Grigg. 1998. “Theoretical and Experimental Analysis of Peeper Equilibration Dynamics.” Environmental Science and Technology 32: 1727–33. ).
The High-Resolution Passive Profiler (HRPP) is a modification of the cylindrical peeper sampler that was initially developed for direct-drive Geoprobe insertion into shallow (~30 ft bgs) aquifers to quantify chlorinated volatile organic compound (CVOC) concentrations, geochemical indicators, CVOC-degrading microorganisms/genes; and to perform compound-specific isotope analysis (CSIA) of CVOCs and estimate interstitial velocity at < 1 ft resolution ( Schneider et al. 2020 [CW8YWUCD] Schneider, Haley A., W. Andrew Jackson, Paul B. Hatzinger, and Charles E. Schaefer. 2020. “High-Resolution Characterization of a Chlorinated Solvent Impacted Aquifer Using a Passive Profiler.” Groundwater Monitoring & Remediation 40 (4): 27–43. https://doi.org/10.1111/gwmr.12409. ) ( Garza-Rubalcava et al. 2022 [6UQBTWYK] Garza-Rubalcava, Uriel, Paul B. Hatzinger, David Schanzle, Graig Lavorgna, Paul Hedman, and W. Andrew Jackson. 2022. “Improved Assessment and Performance Monitoring of a Biowall at a Chlorinated Solvent Site Using High-Resolution Passive Sampling.” Journal of Contaminant Hydrology 246 (April): 103962. https://doi.org/10.1016/j.jconhyd.2022.103962. ). The HRPP design comprises 2.5-inch diameter, 4-foot-long stainless steel rods that can be coupled together to achieve the desired sample interval. The HRPP design consists of three cell types with individual functions that are repeated over the length of the HRPP ( Jackson and Hatzinger 2020 [WLZ5MG5J] Jackson, Dr. Andrew, and Dr. Paul B. Hatzinger. 2020. High Resolution Delineation of Contaminant Concentrations, Biogeochemical Processes, and Microbial Communities in Saturated Subsurface Environments. SERDP Project ER-2419. https://serdp-estcp-storage.s3.us-gov-west-1.amazonaws.com/s3fs-public/project_documents/ER-2419_Final_Report.pdf. ). The three different cell types and corresponding functionalities of the HRPP are:
- Equilibrium cells used to quantify contaminant concentrations and geochemical indicators (for example, NO3–, NO2–, Cl–, Mn, Fe, SO42-). Equilibrium cells function similarly to traditional peeper sampling methods.
- Velocity cells used to measure multidirectional interstitial velocity (cm/d) based on mass transfer of a conservative tracer (for example, bromide). Velocity cells function similarly to equilibrium cells, but the velocity cells also incorporate varied ratios of cell volume to surface area that allow the HRPP cells to equilibrate with the pore water at different rates.
- Microbial/CSIA cells used to assess microbial community structure and CSIA of CVOCs. Microbial/CSIA cells are filled with Bio-Sep beads that perform a dual function by serving as a matrix for microbial colonization and subsequent quantitative polymerase chain reaction (qPCR) analysis, and by accumulating CVOCs for CSIA analysis through adsorption.
The sediment HRPP (sHRPP) is a modified HRPP design that is optimized for characterization of surface water sediments (vs. shallow aquifers). The sHRPP is a 3-ft-long, 5-inch-wide stainless steel modified plate peeper design that includes the same functionalities as the HRPP but has higher resolution of sample cells (< 1 inch resolution) than the HRPP, appropriate for shallow sediment characterization.
SPeeper and PFASsive are modified bottle peeper designs consisting of one or more 60-mL HDPE bottles capped with either polyethersulfone (SPeeper) or polycarbonate (PFASsive) membrane (Figure 5-18). SPeeper and PFASsive are distributed in ready-to-use sample packs and are intended for diverless deployment into shallow sediments for characterization of water-soluble compounds (SPeeper) and PFAS (PFASsive in sediment pore water) (Figure 5-19).
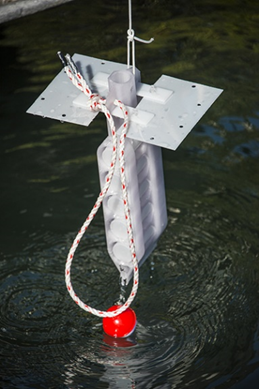
Figure 5-18. SPeeper modified bottle peepers are designed for diverless deployment in sediments.
Source: SiREM, used with permission.
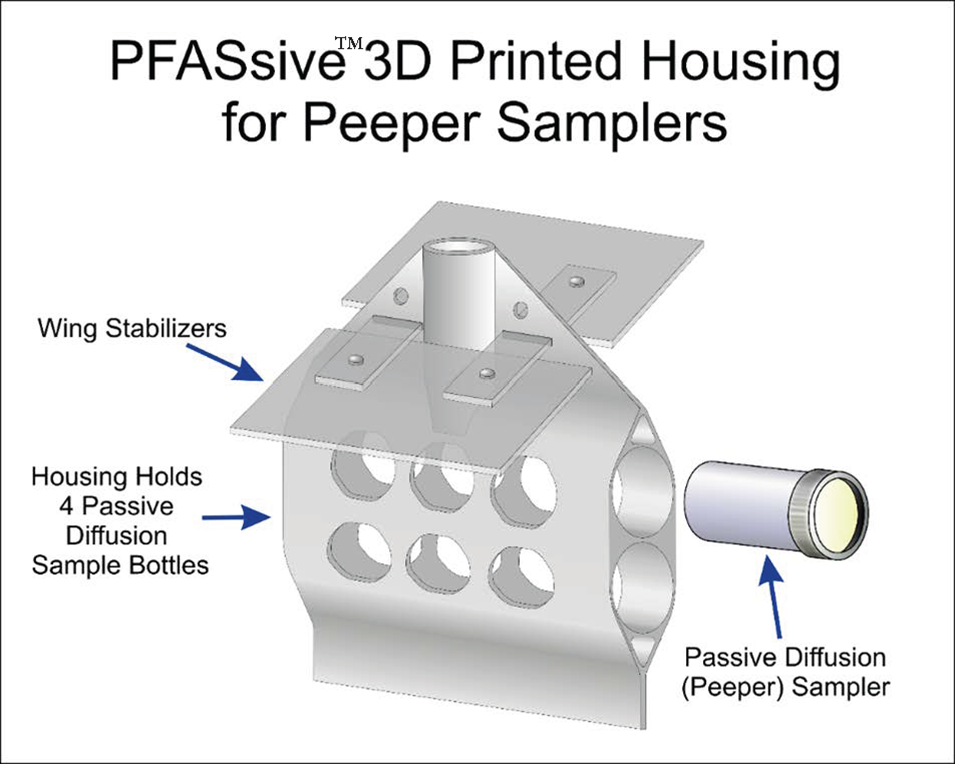
Figure 5-19. PFASsive sampler.
Source: NJDEP, figure used with permission.
5.2.4.3 Advantages
- Commercially available peepers are relatively low cost and user-friendly.
- Peeper types that are directly inserted into saturated soil/sediment are more representative of pore water concentrations than more active sampling methods.
- Peeper types that are intended to be deployed in monitoring wells can be deployed to great depths, and at multiple depth intervals. Deploying multiple peepers in a monitoring well can be a way to achieve more depth-discrete samples than traditional low-flow purging and sampling.
- The “skeleton” of peeper samplers is reusable if properly decontaminated.
- HRPP samplers can be a cost-effective alternative to installing groundwater monitoring wells.
- HRPP and sHRPP samplers offer higher vertical resolution than traditional sampling methods. High-resolution data are beneficial in refining conceptual site models and optimizing targeted monitoring/remediation, leading to long-term cost savings.
5.2.4.4 Limitation
- The PsMS is not commercially available. The sampler cost is estimated at $91 per sampler per well, based on work associated with the former McClellan AFB demonstration study.
- The equilibration time for peeper samplers and PsMS can range from hours to a month, depending upon the contaminant of interest, sediment type, peeper sampler volume, and membrane pore size. A week to 14 days is the most common time to allow chemicals to equilibrate within peeper samplers, which is based on some unpublished lab testing and results from the field. Theoretical and experimental analysis of peeper sampler equilibration dynamics can be found in Environmental Science & Technology Webster, Teasdale, and Grigg ( Webster et al. 1998 [L4CH5QFU] Webster, I. T., P. R. Teasdale, and N. Grigg. 1998. “Theoretical and Experimental Analysis of Peeper Equilibration Dynamics.” Environmental Science and Technology 32: 1727–33. ).
- PsMS samplers are typically designed to fit into wells with a minimum inside diameter of 4 inches. The membrane orientation was demonstrated in only one direction (perpendicular to horizontal flow). The samplers should be constructed under water to ensure that the capsule is completely filled with purified water prior to deployment.
- HRPP and sHRPP sampler assembly, deployment, and sampling require training from experienced users.
- The cost to create a custom HRPP or sHRPP sampler can be over $1,000. A more cost-effective solution is to rent prefabricated HRPP and sHRPP designs.
- Plate and cylinder peepers typically provide small sample volumes (~10 mL) at high depth resolution (cm intervals). Cells can be pooled to produce 100–300 ml per foot. Bottle peepers range in size but typically have a larger sample volume compared to plate peeper samplers.
- The inner membrane(s) cannot be reused.
- Samples withdrawn from wetlands or lacustrine environments, via piston or other coring devices, may be anoxic and would have to be kept anaerobic during transfer to the laboratory. Otherwise, follow normal shipping procedures specified by the intended laboratory.
- The sampler should be deoxygenated (both the receiving media and sampler body if PTFE or polycarbonate) to reduce introduction of oxygen into potentially reducing environments, especially for relatively short deployment times.
5.2.5 Regenerated Cellulose Dialysis Membrane Sampler (RCDM)
5.2.5.1 Description and Application
Regenerated cellulose dialysis membrane (RCDM) (Figure 5-20) samplers are equilibrium-based diffusion samplers, developed to sample dissolved inorganic and organic chemicals in groundwater, pore water, and surface water. RCDM samplers are disposable, so there is no need for field decontamination, and their use eliminates the possibility of cross contamination between wells from the sampling device.
The RCDM sampler consists of a tube, filled with DI water, which has two layers. A high-grade RCDM is contained within a protective layer of LDPE mesh. The RCDM used in previous studies by the USGS has a pore size of 0.0018 µm and a molecular weight cutoff (MWCO) of 8,000 Daltons. Particulates from groundwater and surface water samples cannot pass through, and therefore, RCDM samplers collect only dissolved chemicals. RCDM samplers have been constructed using 31.8 mm (1.25 inches) and 63.7 mm (2.5 inches) filled-diameter membranes.
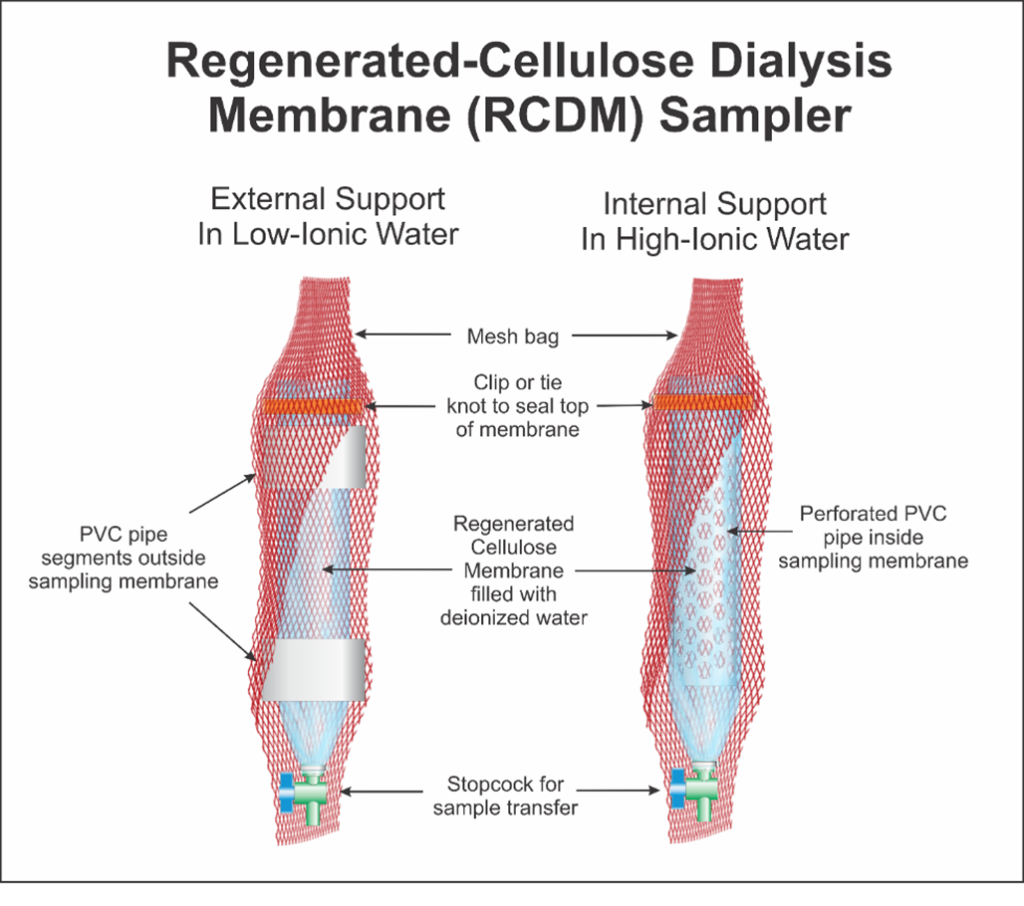
Figure 5-20. Regenerated Cellulose Dialysis Membrane sampler.
Source: NJDEP, figure used with permission.
Because the dialysis membrane is hydrophilic, water can diffuse through the membrane. The sampler may be constructed with or without PVC pipes external to the dialysis membrane in low–ionic strength waters. In high–ionic strength waters, an internal perforated PVC pipe to support the membrane should be used to help maintain water volume within the sampler. The sampler may have a stopcock at one end to facilitate filling with DI water and emptying the sample.
Fully constructed RCDM samplers are not currently available from any commercial vendors ( Imbrigiotta and Harte 2020 [9LSVPE48] Imbrigiotta, Thomas, and Philip Harte. 2020. “Passive Sampling of Groundwater Wells for Determination of Water Chemistry.” In U.S. Geological Survey Techniques and Methods. https://doi.org/10.3133/tm1d8. ). However, precleaned dialysis membranes can readily be purchased from several manufacturers. Because dry RCDMs may contain trace metals and sulfides, it is recommended that precleaned dialysis membrane material be purchased to construct RCDM samplers. The preservative that precleaned RCDM materials come in can easily be removed by rinsing the membranes with DI water several times.
The sampler is constructed from materials that can be purchased from vendors. The regenerated cellulose membrane can be cut to the desired length based on the sample volume required. When constructing this sampler, it is important to have a source of DI water and the user should wear disposable gloves while handling the parts. The membrane needs to be rinsed thoroughly to remove the preservative the regenerated cellulose membrane is shipped in. The LDPE mesh slips around the sampler to protect the membrane during deployment.
Regenerated cellulose samplers have been successfully tested in the lab for a variety of water quality parameters, including VOCs, major cations and anions, nutrients, trace metals, specific conductance, total dissolved solids, dissolved organic carbon, dissolved hydrocarbon gases, sulfide, selected explosive compounds, perchlorate, MTBE, and some PFAS ( Imbrigiotta and Trotsky 2011 [EKS36392] Imbrigiotta, Thomas E., and J. S. Trotsky. 2011. Demonstration and Validation of a Regenerated Cellulose Dialysis Membrane Diffusion Sampler for Monitoring Groundwater Quality and Remediation Progress at DoD Sites: Perchlorate and Ordnance Compounds. ER-200313. ESTCP. https://www.usgs.gov/publications/demonstration-and-validation-a-regenerated-cellulose-dialysis-membrane-diffusion-0. ). RCDM samplers were unsuccessful in sampling for mercury, tin, and silver in the laboratory over a 4-week equilibration period ( Imbrigiotta et al. 2007 [NHT8I6B8] Imbrigiotta, Thomas E., J. S. Trotsky, and M. C. Place. 2007. Demonstration and Validation of a Regenerated Cellulose Dialysis Membrane Diffusion Sampler for Monitoring Ground-Water Quality and Remediation Progress at DoD Sites. TR-2281-ENV. Technical Report. Naval Facilities Engineering Service. https://pubs.usgs.gov/publication/70206138. ). These trace metals may form organic complexes that strongly sorb to the membrane.
5.2.5.2 Installation and Use
RCDM samplers are typically deployed in the saturated interval of the well screen or in the saturated open interval of an open borehole well at a desired sampling depth consistent with site DQOs. For deployment, the sampler is attached to a weighted suspension-tether and lowered to the intended depth, and the tether is secured at the top of the well ( Imbrigiotta et al. 2008 [JMSBJG6B] Imbrigiotta, Thomas E., J. S. Trotsky, and M. C. Place. 2008. Protocol for Use of Regenerated Cellulose Dialysis Membrane Diffusion Samplers (ER-0313): ESTCP. ESTCP Protocol Report for Project ER-0313. http://www.estcp.org/Technology/upload/ER-0313-Protocol.pdf. ; Imbrigiotta and Harte 2020 [9LSVPE48] Imbrigiotta, Thomas, and Philip Harte. 2020. “Passive Sampling of Groundwater Wells for Determination of Water Chemistry.” In U.S. Geological Survey Techniques and Methods. https://doi.org/10.3133/tm1d8. ). Multiple RCDMs can be deployed in a single well to sample at discrete intervals to vertically profile the water chemistry in the open interval.
After deployment, the RCDM sampler(s) must remain in the well for sufficient time (minimum residence time) for (1) hydraulic stabilization of the groundwater flow through the open interval of a well after the introduction of the sampler, and (2) chemical equilibration of the water inside the sampler membrane with the groundwater flowing past it outside the sampler membrane. Retrieve the dialysis sampler from the well after the appropriate equilibration time and transfer the samples to standard sample containers. The containers can be sent to the laboratory for direct analysis of water concentrations.
Laboratory equilibration testing has shown that RCDM samplers chemically equilibrate within the times below, not including the time it takes the well to restabilize hydraulically.
- 1–3 days for anions, silica, methane, dissolved organic carbon, and all VOCs on the USEPA 8260B list (including MTBE) ( Ehlke et al. 2004 [8QGB998Q] Ehlke, T. A., T. E. Imbrigiotta, and J. M. Dale. 2004. “Laboratory Comparison of Polyethylene and Dialysis Membrane Diffusion Samplers.” Ground Water Monitoring and Remediation 24 (1): 53–59. ; Harter and Talozi 2004; Imbrigiotta and Trotsky 2011 [EKS36392] Imbrigiotta, Thomas E., and J. S. Trotsky. 2011. Demonstration and Validation of a Regenerated Cellulose Dialysis Membrane Diffusion Sampler for Monitoring Groundwater Quality and Remediation Progress at DoD Sites: Perchlorate and Ordnance Compounds. ER-200313. ESTCP. https://www.usgs.gov/publications/demonstration-and-validation-a-regenerated-cellulose-dialysis-membrane-diffusion-0. )
- 3–7 days for most cations and trace elements ( Vroblesky et al. 2002 [47IYEXTP] Vroblesky, Don A., Matthew D. Petkewich, and Ted R. Campbell. 2002. Field Tests of Diffusion Samplers for Inorganic Constituents in Wells and at a Ground-Water-Discharge Zone. Water-Resources Investigations Report Nos. 02–4031. U.S. Geological Survey. https://pubs.usgs.gov/wri/wri024031/pdf/wrir02-4031.pdf. ; Imbrigiotta et al. 2007 [NHT8I6B8] Imbrigiotta, Thomas E., J. S. Trotsky, and M. C. Place. 2007. Demonstration and Validation of a Regenerated Cellulose Dialysis Membrane Diffusion Sampler for Monitoring Ground-Water Quality and Remediation Progress at DoD Sites. TR-2281-ENV. Technical Report. Naval Facilities Engineering Service. https://pubs.usgs.gov/publication/70206138. )
- 7–14 days for most explosive compounds and perchlorate ( LeBlanc 2003 [NB6GALSH] LeBlanc, D. R. 2003. Diffusion and Drive-Point Sampling to Detect Ordnance-Related Compounds in Shallow Groundwater beneath Snake Pond, Cape Cod. Nos. 03–4133. U.S. Geological Survey Water Resources Investigations. Cape Cod, Massachusetts. ; Parker and Mulherin 2006 [YFJSZNEU] Parker, L. V., and N. D. Mulherin. 2006. “Preliminary Studies of Alternative Passive Diffusion Devices for Sampling Explosives.” Proceedings of 2006 North American Environmental Field Conference and Exposition (Tampa, FL). ; Imbrigiotta and Trotsky 2011 [EKS36392] Imbrigiotta, Thomas E., and J. S. Trotsky. 2011. Demonstration and Validation of a Regenerated Cellulose Dialysis Membrane Diffusion Sampler for Monitoring Groundwater Quality and Remediation Progress at DoD Sites: Perchlorate and Ordnance Compounds. ER-200313. ESTCP. https://www.usgs.gov/publications/demonstration-and-validation-a-regenerated-cellulose-dialysis-membrane-diffusion-0. )
- Field equilibration testing has shown that RCDM samplers yield concentrations of VOCs similar to those yielded by PDBs and low-flow purging and sampling ( Vroblesky et al. 2002 [47IYEXTP] Vroblesky, Don A., Matthew D. Petkewich, and Ted R. Campbell. 2002. Field Tests of Diffusion Samplers for Inorganic Constituents in Wells and at a Ground-Water-Discharge Zone. Water-Resources Investigations Report Nos. 02–4031. U.S. Geological Survey. https://pubs.usgs.gov/wri/wri024031/pdf/wrir02-4031.pdf. , 2; Vroblesky et al. 2002 [47IYEXTP] Vroblesky, Don A., Matthew D. Petkewich, and Ted R. Campbell. 2002. Field Tests of Diffusion Samplers for Inorganic Constituents in Wells and at a Ground-Water-Discharge Zone. Water-Resources Investigations Report Nos. 02–4031. U.S. Geological Survey. https://pubs.usgs.gov/wri/wri024031/pdf/wrir02-4031.pdf. ; Parsons 2005 [IKZXKLEL] Parsons. 2005. FINAL: Results Report for the Demonstration of No-Purge Groundwater Sampling Devices at Former McClellan Air Force Base, California. Nos. F44650-9900005. https://clu-in.org/download/char/passsamp/mcclellan_final_results_report.pdf. ; Vroblesky and Peterson 2004 [55GWXGM2] Vroblesky, Don A., and J. E. Peterson. 2004. Flow-Meter and Passive Diffusion Bag Tests and Potential Influences on the Vertical Distribution of Contaminants in Wells at Galena Airport, Galena, Alaska, August to October 2002. U.S. Geological Survey Open-File Report Nos. 2004–124. USGS. https://www.researchgate.net/publication/235060843_Flow-Meter_and_Passive_Diffusion_Bag_Tests_and_Potential_Influences_on_the_Vertical_Distribution_of_Contaminants_in_Wells_at_Galena_Airport_Galena_Alaska_August_to_October_2002. ; Imbrigiotta et al. 2002 [E2E8XZ2J] Imbrigiotta, Thomas E., T. A. Ehlke, P. J. Lacombe, and J. M. Dale. 2002. “Comparison of Dialysis Membrane Diffusion Samplers and Two Purging Methods in Bedrock Wells.” 195–206. https://pubs.usgs.gov/publication/70023982. ; Vroblesky et al. 2003 [2CU779MA] Vroblesky, D. A., J. Manish, J. Morrell, and J. E. Peterson. 2003. Evaluation of Passive Diffusion Bag Samplers, Dialysis Samplers, and Nylon-Screen Samplers in Selected Wells at Andersen Air Force Base. Nos. 03–4157. U.S. Geological Survey Water Resources Investigations. ; Imbrigiotta et al. 2007 [NHT8I6B8] Imbrigiotta, Thomas E., J. S. Trotsky, and M. C. Place. 2007. Demonstration and Validation of a Regenerated Cellulose Dialysis Membrane Diffusion Sampler for Monitoring Ground-Water Quality and Remediation Progress at DoD Sites. TR-2281-ENV. Technical Report. Naval Facilities Engineering Service. https://pubs.usgs.gov/publication/70206138. ). Imbrigiotta and Trotsky ( Imbrigiotta and Trotsky 2011 [EKS36392] Imbrigiotta, Thomas E., and J. S. Trotsky. 2011. Demonstration and Validation of a Regenerated Cellulose Dialysis Membrane Diffusion Sampler for Monitoring Groundwater Quality and Remediation Progress at DoD Sites: Perchlorate and Ordnance Compounds. ER-200313. ESTCP. https://www.usgs.gov/publications/demonstration-and-validation-a-regenerated-cellulose-dialysis-membrane-diffusion-0. ) also showed that RCDM samplers yield concentrations of most inorganic chemicals, dissolved organic carbon, and most explosives similar to those collected by low-flow purging and sampling. There is also some preliminary evidence that RCDM samplers are able to recover concentrations of selected PFAS compounds, as well as low-flow purging does ( Imbrigiotta et al. 2008 [JMSBJG6B] Imbrigiotta, Thomas E., J. S. Trotsky, and M. C. Place. 2008. Protocol for Use of Regenerated Cellulose Dialysis Membrane Diffusion Samplers (ER-0313): ESTCP. ESTCP Protocol Report for Project ER-0313. http://www.estcp.org/Technology/upload/ER-0313-Protocol.pdf. ).
5.2.5.3 Advantages
- RCDM samplers provide a sample of dissolved chemicals, keeping out suspended particles.
- RCDM samplers have been lab- and field-tested for a wide range of commonly sampled organic and inorganic chemicals.
- RCDM sampler volume is dependent on diameter and length of sampler. The volume contained can be easily increased or decreased during construction, unlike some other equilibrium samplers that are volume-limited.
5.2.5.4 Limitations
- RCDM sampling devices are not commercially available, so they must be constructed by the user, and this requires some training. RCDMs are readily available for purchase from several vendors. The price per foot of regenerated cellulose membrane is more costly than polyethylene membrane, but PDBs cannot be used to sample for inorganics.
- RCDM samplers must be kept hydrated in DI water between construction and deployment to maintain the permeability, flexibility, and strength of the membrane.
- RCDMs can biodegrade within 4 weeks, depending on groundwater temperatures and bacterial populations, resulting in perforations and partial to total sample loss. However, all chemicals successfully sampled by RCDM samplers require equilibration times of only 2–3 weeks.
- RCDM samplers lose a small percentage of their water volume with time (<3% per week) due to the nature of the dialysis process ( Imbrigiotta et al. 2007 [NHT8I6B8] Imbrigiotta, Thomas E., J. S. Trotsky, and M. C. Place. 2007. Demonstration and Validation of a Regenerated Cellulose Dialysis Membrane Diffusion Sampler for Monitoring Ground-Water Quality and Remediation Progress at DoD Sites. TR-2281-ENV. Technical Report. Naval Facilities Engineering Service. https://pubs.usgs.gov/publication/70206138. ). This is not a significant problem in fresh water when RCDM samplers are installed for less than 4 weeks. In saline waters, the water loss can be minimized by installing an internal support inside the dialysis membrane.
5.2.6 Rigid Porous Polyethylene Sampler (RPPS)
5.2.6.1 Description and Application
Rigid porous polyethylene samplers (RPPSs) (Figure 5-21) are diffusion-based samplers that were developed to sample for a broader range of chemicals than can be collected by the PDB sampler, including both organic and inorganic chemicals. The RPPS was specifically designed to collect groundwater samples from a discrete interval in monitoring or water wells. The RPPS can also be used to collect water from surface water and pore water.
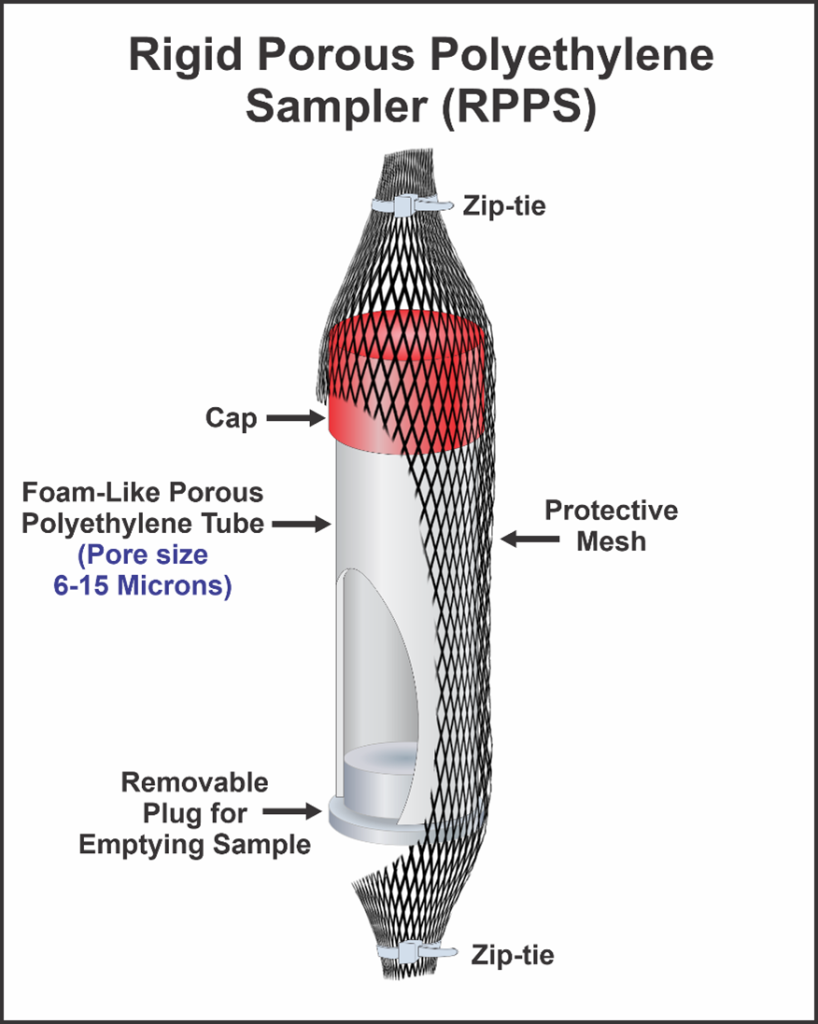
Figure 5-21. Rigid porous polyethylene sampler.
Source: NJDEP, figure used with permission.
The RPPS that is currently available commercially consists of a 1.5-inch OD, 6-inch-long, rigid porous polyethylene tube with a plug on one end and a cap on the other end ( Imbrigiotta and Harte 2020 [9LSVPE48] Imbrigiotta, Thomas, and Philip Harte. 2020. “Passive Sampling of Groundwater Wells for Determination of Water Chemistry.” In U.S. Geological Survey Techniques and Methods. https://doi.org/10.3133/tm1d8. ). The tube is constructed from thin sheets of foam-like porous polyethylene with pore sizes of 6–15 µm ( Imbrigiotta and Harte 2020 [9LSVPE48] Imbrigiotta, Thomas, and Philip Harte. 2020. “Passive Sampling of Groundwater Wells for Determination of Water Chemistry.” In U.S. Geological Survey Techniques and Methods. https://doi.org/10.3133/tm1d8. ). The sampler is filled with DI water and closed at both ends; additional water is added under pressure to overcome the hydrophobic nature of the material and saturate the pores. Using care in handling so the sampler will not lose water, the RPPS is inserted into a polyethylene mesh tube, attached to a weighted suspension tether using cable ties, and deployed in a well or surface water or sediment environment. Over time, chemicals diffuse through the water-filled pores of the porous polyethylene and equilibrate with the water inside the sampler. Upon retrieval, the plug is removed, and the contents of the sampler are poured into laboratory sample containers. The sampler may leak water upon retrieval due to the pore size of the polyethylene tubing. Although surface tension of the water can keep most of the sample within the sampler, the RPPS should be removed with care to avoid disturbing the surface tension within the sampler. Filtration may be required to achieve a dissolved-only groundwater sample for metal analysis.
The original, patented RPPS prototype consisted of a 1.5-inch-OD, 6- to 7-inch-long, 2-mm thick, rigid polyethylene tube with caps and valves at both ends ( Battelle 2010 [257L2DVF] Battelle. 2010. “Department of the Navy Guidance for Planning and Optimizing Monitoring Strategies.” U.S. Department of Defense, Department of the Navy, November. https://frtr.gov/matrix/documents/Monitored-Natural-Attenuation/2010-Guidance-for-Planning-and-Optimization-of-Remedial-Strategies.pdf. . Upon retrieval the original prototype tended to leak sample water through the pores of the porous polyethylene material ( Imbrigiotta and Harte 2020 [9LSVPE48] Imbrigiotta, Thomas, and Philip Harte. 2020. “Passive Sampling of Groundwater Wells for Determination of Water Chemistry.” In U.S. Geological Survey Techniques and Methods. https://doi.org/10.3133/tm1d8. ). Subsequent designs of shorter lengths using a Delrin plug at the lower end have significantly reduced leakage. When VOCs are analytes of interest, an additional small plug is placed in the Delrin plug. Use of this smaller plug minimizes potential loss of VOCs by any vacuum that might be created when the plug is removed.
5.2.6.2 Installation and Use
RPPSs are shipped in a disposable DI-water-filled sleeve. The RPPS is deployed plug-end down in a predetermined interval in a groundwater well and left to equilibrate for at least 14 days (depending on target chemicals) or until the next sampling event. The maximum deployment period is unknown. The currently available RPPS must be deployed in a well with an inside diameter of at least 2 inches. When the RPPS is retrieved, it is inverted, the plug is removed, and the contents are poured into the sample bottles immediately. Compared to the original design, leakage is minimized and sample transfer into the bottles is much quicker.
The RPPS was specifically designed to collect groundwater samples from a discrete interval in monitoring or water wells. These samplers can monitor most compounds (both inorganic and organic) present in dissolved phases in the groundwater as the sampler volume allows.
Previous testing indicated that the maximum feasible sampler length is approximately 7.5 inches. Use of a longer sampler would result in leakage of sampled water out of the sampler walls due to the higher head pressure present in the sampler that overcomes the surface tension of the water at the pore interface, forcing water through any pores with more than about 6–7 inches of head ( Imbrigiotta and Harte 2020 [9LSVPE48] Imbrigiotta, Thomas, and Philip Harte. 2020. “Passive Sampling of Groundwater Wells for Determination of Water Chemistry.” In U.S. Geological Survey Techniques and Methods. https://doi.org/10.3133/tm1d8. ). The current 1.5-inch OD RPPS design contains approximately 110 mL. Larger volumes could be obtained by using a larger-diameter sampler, when the well diameter allows; however larger diameters are not currently commercially available. Larger sample volumes can be obtained by using multiple samplers attached end-to-end or side-by-side (if well diameter allows). The limited sample volume requires careful consideration of the total sample volume needed for each project. This may include coordination with the laboratory to address any sample volume limitations.
RPPS devices were included in a field demonstration of multiple passive groundwater sampling devices at the former McClellan Air Force Base (Sacramento, California) in 2004 ( Parsons 2005 [IKZXKLEL] Parsons. 2005. FINAL: Results Report for the Demonstration of No-Purge Groundwater Sampling Devices at Former McClellan Air Force Base, California. Nos. F44650-9900005. https://clu-in.org/download/char/passsamp/mcclellan_final_results_report.pdf. ). According to the field demonstration data, the RPPS performs well at monitoring for anions, metals, and hexavalent chromium. Although it performed similarly to the low-flow purge method for metals and inorganics, the RPPS did not provide results similar to low-flow purge for some VOCs, SVOCs, and other HOCs. It is suspected that such compounds with low recoveries sorbed to the polyethylene material and there was insufficient time to reach static equilibrium with the polyethylene material. Table 5-2 shows general applicability to chemicals of interest, as found in previous laboratory and field pilots. When using water-filled diffusion samplers to sample redox-sensitive parameters in a well that maintains anaerobic water in the well bore, one approach to avoid oxidation and precipitation of redox-sensitive metals is to use anaerobic water as the sampler filling solution. This method would require special handling of prefilled samplers. However, when oxygenated water is used to fill the RPPS that is deployed in anaerobic water, the solution within the sampler becomes anaerobic over time by diffusion. Not enough work has been done yet to define when prefilling with anaerobic water is necessary or if there will be an effect on equilibration time.
5.2.6.3 Advantages
- RPPSs are applicable to inorganic and organic analytes.
- They are supplied field-ready.
- Decontamination of the RPPS is not needed because the device is disposable.
5.2.6.4 Limitations
- The cost of RPPS is at the high end for equilibration samplers.
- Multiple samplers may need to be deployed to obtain sufficient volume for laboratory analysis if testing for a wide range of chemicals. Coordination with the laboratory beforehand can avoid volume limitation as a concern.
- Additional testing may be necessary to understand possible chemical limitations for these samplers (in particular, hydrophobic VOCs and SVOCs).
- The samplers fit into wells with a minimum inner diameter of 2.0 inches.
- The porous polyethylene sampler pores often hold air even when submerged. Consequently, the oxygen entrained in the pore space must be removed by sparging with water and nitrogen prior to deployment.
- RPSSs should be deoxygenated (both the receiving media and sampler body if PTFE or polycarbonate) to reduce introduction of oxygen into potentially reducing environments, especially for relatively short deployment times.
5.2.7 Polymeric Sampling Devices
5.2.7.1 Description and Application
Polymeric sampling devices are diffusion-based samplers intended to sample surface water, groundwater, porewater, and air. Polymeric sampling devices consisting of LDPE, polydimethylsiloxane (PDMS)–coated glass fiber (that is, solid-phase microextraction [SPME] fiber), and/or polyoxymethylene (POM) are single-phase passive samplers that have been widely used in the United States to measure freely dissolved concentrations of various HOCs present in surface water, groundwater, and pore water ( Burgess et al. 2017 [97JRK4GH] Burgess, R. M., S. B. Kane Driscoll, A. Burton, et al. 2017. Laboratory, Field, and Analytical Procedures for Using Passive Sampling in the Evaluation of Contaminated Sediments: User’s Manual. User’s Manual EPA/600/R-16/357. USEPA and SERDP-ESTCP. https://semspub.epa.gov/work/HQ/100000146.pdf. ) (Figure 5-22). The term “SPME” has been most often applied to the use of PDMS-coated glass fiber; however, POM and LDPE also essentially involve solid-phase extraction processes. Although a variety of polymeric materials, such as silicon rubbers, cyclodextrin (Tenax), and ethylene–octene copolymer, have been used for passive sampling, this section primarily focuses on LDPE, PDMS-coated glass fiber, and POM, given their prevalence and current use in the United States. More recently, advances in polymeric sampling have resulted in a shift to reliance on LDPE and PDMS-coated glass fiber ( Michalsen et al. 2018 [IEVQDPQE] Michalsen, Mandy, Danny Reible, Adesewa Aribidara, et al. 2018. Standardizing Polymeric Sampling for Measuring Freely-Dissolved Organic Contaminants in Sediment Porewater. Standardized Method Memo ER-201735. ESTCP. https://apps.dtic.mil/sti/pdfs/AD1084245.pdf. ).
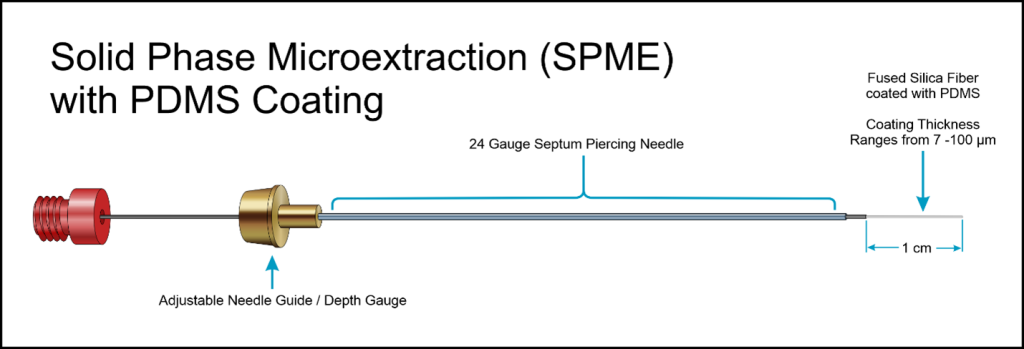
Figure 5-22. PDMS-coated solid-phase microextraction sampler.
Source: NJDEP, figure used with permission
These three polymers have similar, but not identical, sorption properties in different geometries or configurations. POM and LDPE are typically configured in thin bulk flat sheets from 10 to 100 µm in thickness, while PDMS-coated glass fiber is cylindrical glass capillaries (100–1,000 μm diameter) coated with a thin PDMS polymer (10–35 μm) ( Burgess et al. 2017 [97JRK4GH] Burgess, R. M., S. B. Kane Driscoll, A. Burton, et al. 2017. Laboratory, Field, and Analytical Procedures for Using Passive Sampling in the Evaluation of Contaminated Sediments: User’s Manual. User’s Manual EPA/600/R-16/357. USEPA and SERDP-ESTCP. https://semspub.epa.gov/work/HQ/100000146.pdf. ). The most common thickness used for PDMS is 35 µm. For PDMS-coated SPMEs, the PDMS coating the glass fiber SPME rods is generally around 30–100 µm thick, with a typical thickness of 35 µm (see Figure 5-22) ( Michalsen et al. 2018 [IEVQDPQE] Michalsen, Mandy, Danny Reible, Adesewa Aribidara, et al. 2018. Standardizing Polymeric Sampling for Measuring Freely-Dissolved Organic Contaminants in Sediment Porewater. Standardized Method Memo ER-201735. ESTCP. https://apps.dtic.mil/sti/pdfs/AD1084245.pdf. ).
When polymeric sampling devices are deployed in aqueous media, those can measure the freely dissolved concentrations, which can be used directly to assess chemical exposure and bioavailability without corrections on dissolved organic carbon or colloidal matter effect. The freely dissolved concentrations of HOCs are considered to be more representative as bioavailable concentrations of those chemicals. Polymeric sampling devices are also often used to measure gaseous concentrations of various organic pollutants in air ( Khairy and Lohmann 2014 [ZX9DHJSU] Khairy, Mohammed A., and Rainer Lohmann. 2014. “Field Calibration of Low Density Polyethylene Passive Samplers for Gaseous POPs.” Environmental Science. Processes & Impacts 16 (3): 414–21. https://doi.org/10.1039/c3em00493g. ) and to monitor long-term personal exposures ( Samon et al. 2022 [ZD3GYDYS] Samon, Samantha M., Stephanie C. Hammel, Heather M. Stapleton, and Kim A. Anderson. 2022. “Silicone Wristbands as Personal Passive Sampling Devices: Current Knowledge, Recommendations for Use, and Future Directions.” Environment International 169 (November): 107339. https://doi.org/10.1016/j.envint.2022.107339. , O’Connell et al. 2014 [YDD93BAF] O’Connell, Steven G., Laurel D. Kincl, and Kim A. Anderson. 2014. “Silicone Wristbands as Personal Passive Samplers.” Environmental Science & Technology 48 (6): 3327–35. https://doi.org/10.1021/es405022f. ). Polymeric sampling devices rely on the equilibrium partitioning of a contaminant of interest between the sampler and water or via diffusion. The use of polymeric passive samplers enables the determination pf time-weighted averaged concentrations of HOCs at low detection levels without the need for high-volume media collection.
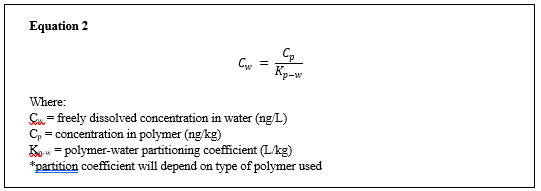
After retrieval, target chemicals are extracted from a polymeric sampling device and their concentrations are determined. Subsequently, the concentrations in the sampling devices are converted to concentrations in water or air by applying the polymer-water or polymer-air partitioning coefficients. For example, the freely dissolved concentration of a target chemical in aqueous media can be estimated from the measured concentration in a polymeric sampling device and a polymer-water partition coefficient as shown in Equation 2 ( Mayer et al. 2003 [NXMH6HGA] Mayer, Philipp, Johannes Tolls, Joop L. M. Hermens, and Donald Mackay. 2003. “Peer Reviewed: Equilibrium Sampling Devices.” Environmental Science & Technology 37 (9): 184A-191A. https://doi.org/10.1021/es032433i. ). The partition coefficient of a target chemical between a polymer and water or air are available in the scientific literature for LDPE, PDMS, and POM ( Mayer et al. 2003 [NXMH6HGA] Mayer, Philipp, Johannes Tolls, Joop L. M. Hermens, and Donald Mackay. 2003. “Peer Reviewed: Equilibrium Sampling Devices.” Environmental Science & Technology 37 (9): 184A-191A. https://doi.org/10.1021/es032433i. ).
Polymeric sampling devices need to be deployed in a target media long enough to allow the chemical partitioning to fully or partially reach equilibrium to accurately determine concentrations of target chemicals. Multiple factors influence the time required to reach equilibrium, including chemicals of interest, types and dimensions of polymer used, flow conditions, temperature, and other environmental factors. If equilibrium is not achieved during the deployment time, disequilibrium must be corrected to determine the concentrations of target chemicals. PRCs are commonly spiked into the polymeric sampling devices to allow the estimation of the fraction of equilibrium during deployment ( Huckins et al. 2002 [DN3HJ22M] Huckins, James N., Jimmie D. Petty, Jon A. Lebo, et al. 2002. “Development of the Permeability/Performance Reference Compound Approach for in Situ Calibration of Semipermeable Membrane Devices.” Environmental Science & Technology 36 (1): 85–91. https://doi.org/10.1021/es010991w. ). PRCs are analytically noninterfering chemicals that are spiked in the polymeric sampling devices prior to deployment. Because both the uptake and the dissipation of HOCs are governed by thermodynamically regulated chemical partitioning, the dissipation rate of PRCs during deployment reflects the uptake rate of a target chemical ( Burgess et al. 2017 [97JRK4GH] Burgess, R. M., S. B. Kane Driscoll, A. Burton, et al. 2017. Laboratory, Field, and Analytical Procedures for Using Passive Sampling in the Evaluation of Contaminated Sediments: User’s Manual. User’s Manual EPA/600/R-16/357. USEPA and SERDP-ESTCP. https://semspub.epa.gov/work/HQ/100000146.pdf. ). PRCs commonly used are isotope-labeled (for example, 13C), or deuterated forms of the target chemicals of interest, (for example, PAHs, 13C-labeled PCBs, and 13C-labeled dioxin). PCB congeners rarely found in the environment can also be used as PRCs. These PRCs are preloaded into a polymeric sampling device, and the loss of PRCs during deployment is then quantified and used to correct the concentration when equilibrium is not achieved during the deployment period ( Burgess et al. 2017 [97JRK4GH] Burgess, R. M., S. B. Kane Driscoll, A. Burton, et al. 2017. Laboratory, Field, and Analytical Procedures for Using Passive Sampling in the Evaluation of Contaminated Sediments: User’s Manual. User’s Manual EPA/600/R-16/357. USEPA and SERDP-ESTCP. https://semspub.epa.gov/work/HQ/100000146.pdf. ).
As discussed in Section 2.2.3, polymeric sampling devices can be deployed in the field (in situ) or in the laboratory (ex situ) to determine freely dissolved concentrations of hydrophobic organic compounds in sediment pore water. In ex situ deployment, sediment samples collected from the field site are shipped on ice in a cooler to the laboratory. Polymeric sampling devices are added to the sediment jars and equilibrated with sediment pore water by either “active” (continuously mixed) or “static” (no mixing) exposures in the laboratory for a duration sufficient to reach equilibrium among the polymeric sampling device, bulk sediment, and sediment pore water. There are several factors to consider when selecting between the ex situ and in situ approaches, and those are summarized well elsewhere ( Ghosh et al. 2014 [T8GHY3EM] Ghosh, Upal, Susan Kane Driscoll, Robert M. Burgess, et al. 2014. “Passive Sampling Methods for Contaminated Sediments: Practical Guidance for Selection, Calibration, and Implementation.” Integrated Environmental Assessment and Management 10 (2): 210–23. https://doi.org/10.1002/ieam.1507. ). When PDMS-coated glass fibers are deployed in situ, perforated stainless steel rods, perforated cylindrical copper housing, or similar enclosures are typically used to ensure the samplers are protected while maintaining contact with the surrounding media. LDPE is often enclosed in a stainless steel mesh sleeve or protected by a metal frame. Deployment times can vary depending on sampling conditions, in situ versus ex situ exposure parameters, and the target analytes being measured. Both LDPE and PDMS-coated glass fiber typically require 30 days of deployment to measure most HOCs ex situ. However, more hydrophobic compounds, such as PCBs and dioxin/furans, typically require the minimum residence time, along with potential corrections to account for analytes that do not achieve equilibrium relative to less hydrophobic compounds, such as PAHs.
Numerous guidance documents and tools have been developed to support application of these types of passive samplers in multiple phases of site investigation and monitoring. The USEPA published a 2017 user’s manual along with calculator tools for data analysis available on the USEPA’s website. Regulatory acceptance of integrating passive samplers into site characterization and monitoring has increased in recent years. Although no published standard methods are currently available for polymeric passive samplers, numerous studies have been conducted to standardize the preparation and analysis ( Jonker et al. 2018 [UFDMH7LV] Jonker, Michiel T. O., Stephan A. van der Heijden, Dave Adelman, et al. 2018. “Advancing the Use of Passive Sampling in Risk Assessment and Management of Sediments Contaminated with Hydrophobic Organic Chemicals: Results of an International Ex Situ Passive Sampling Interlaboratory Comparison.” Environmental Science & Technology 52 (6): 3574–82. https://doi.org/10.1021/acs.est.7b05752. ; Lotufo et al. 2022 [BM8MW6FA] Lotufo, Guilherme R., Mandy M. Michalsen, Danny D. Reible, et al. 2022. “Interlaboratory Study of Polyethylene and Polydimethylsiloxane Polymeric Samplers for Ex Situ Measurement of Freely Dissolved Hydrophobic Organic Compounds in Sediment Porewater.” Environmental Toxicology and Chemistry 41 (8): 1885–902. https://doi.org/10.1002/etc.5356. ).
The LDPE pore water samplers (Figure 5-23) consist of a clean, uncoated sheet of LDPE, which can vary in thickness but is generally from 13 to 76 µm (Figure 5-23) ( Burgess et al. 2017 [97JRK4GH] Burgess, R. M., S. B. Kane Driscoll, A. Burton, et al. 2017. Laboratory, Field, and Analytical Procedures for Using Passive Sampling in the Evaluation of Contaminated Sediments: User’s Manual. User’s Manual EPA/600/R-16/357. USEPA and SERDP-ESTCP. https://semspub.epa.gov/work/HQ/100000146.pdf. ). The dimensions of the LDPE can be developed to meet specific project conditions and deployment requirements. These samplers are most typically deployed within an open frame or a metal mesh envelope.
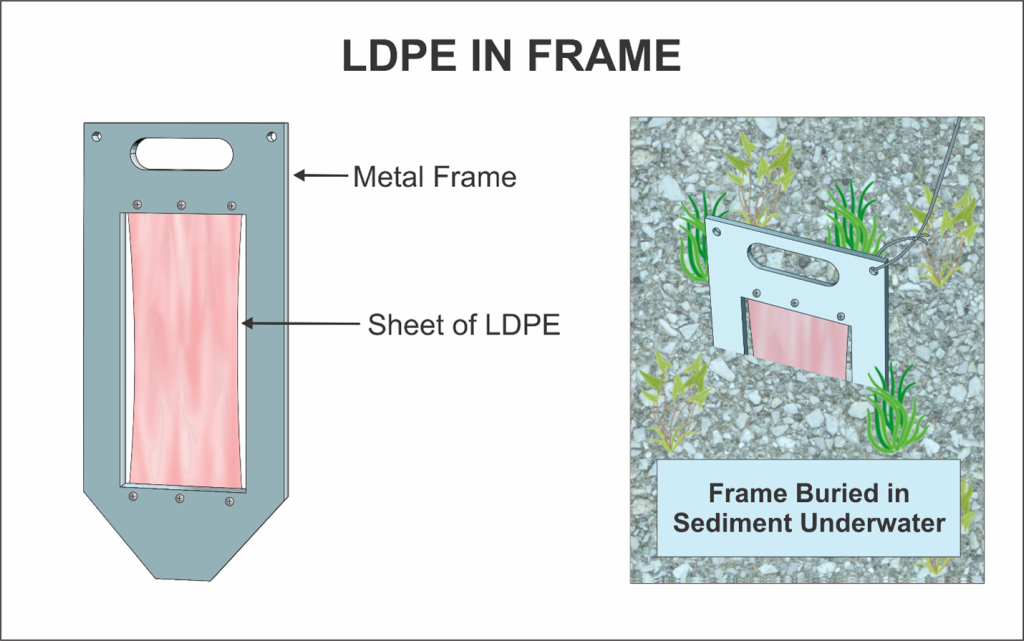
Figure 5-23. Low-density polyethylene sampler.
Source: NJDEP, figure used with permission.
The polyurethane foam passive air sampler (PUF-PAS) is a device used to monitor the presence, distribution, and concentration of airborne chemicals over a long-term deployment period without actively pumping the air. PUF-PAS passively collects airborne chemicals onto a PUF disk, which absorbs chemicals transported by advection and diffusion ( Moeckel et al. 2009 [6QW9AHVA] Moeckel, Claudia, Tom Harner, Luca Nizzetto, Bo Strandberg, Andres Lindroth, and Kevin C. Jones. 2009. “Use of Depuration Compounds in Passive Air Samplers: Results from Active Sampling-Supported Field Deployment, Potential Uses, and Recommendations | Environmental Science & Technology.” Environ. Sci. Technol 43 (9): 3227–32. https://pubs.acs.org/doi/10.1021/es802897x. ). The PUF disk is uniformly porous and has a large surface area to allow gaseous chemicals to diffuse and absorb. The PUF disk also filters chemicals associated with particulates ( Klánová et al. 2008 [QR58D68B] Klánová, Jana, Pavel Èupr, Jiří Kohoutek, and Tom Harner. 2008. “Assessing the Influence of Meteorological Parameters on the Performance of Polyurethane Foam-Based Passive Air Samplers.” Environmental Science & Technology 42 (2): 550–55. https://doi.org/10.1021/es072098o. ; Chaemfa et al. 2009 [DE6HQ489] Chaemfa, Chakra, Edward Wild, Brian Davison, Jonathan L. Barber, and Kevin C. Jones. 2009. “A Study of Aerosol Entrapment and the Influence of Wind Speed, Chamber Design and Foam Density on Polyurethane Foam Passive Air Samplers Used for Persistent Organic Pollutants.” Journal of Environmental Monitoring 11 (6): 1135–39. https://doi.org/10.1039/B823016A. ; Bohlin et al. 2010 [6ANIGI7G] Bohlin, Pernilla, Kevin C. Jones, and Bo Strandberg. 2010. “Field Evaluation of Polyurethane Foam Passive Air Samplers to Assess Airborne PAHs in Occupational Environments.” Environmental Science & Technology 44 (2): 749–54. https://doi.org/10.1021/es902318g. ).
The PUF disk is usually housed in a protective stainless steel casing that shields it from direct sunlight, precipitation, the deposition of other particles, and physical damage while acting to buffer the air flow and allowing air to gently flow around the PUF disk. Target organic chemicals in gaseous phase diffuse and partition into PUF. Similar to the LDPE and PDMS polymeric devices, the PUF-air partition coefficients (KPUF-A) predict the partitioning of target chemicals between PUF and the gaseous phase at partition equilibrium ( Shoeib and Harner 2002 [MI632BXE] Shoeib, Mahiba, and Tom Harner. 2002. “Characterization and Comparison of Three Passive Air Samplers for Persistent Organic Pollutants.” Environmental Science & Technology 36 (19): 4142–51. https://doi.org/10.1021/es020635t. ). Because the PUF disk used in PUF-PAS has an extremely large sorption capacity for persistent organic pollutants (POPs), most POPs do not reach partition equilibrium within a reasonable deployment time (weeks or months). Target chemical concentrations in the air are often calculated from the sampling rate and deployment time at the linear uptake regime (Equation 3).
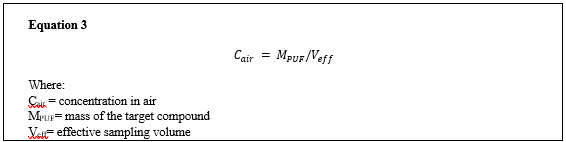
5.2.7.2 Installation and Use
Polymeric passive samplers are typically deployed within a protective metal mesh sleeve, frame, or perforated metal rod. Samplers deployed within a sediment bed can be segmented and analyzed upon retrieval to obtain stratified discrete concentration results. Samplers can also be deployed into the sediment bed to also capture the near-bottom surface water.
These passive samplers can be used for both ex situ and in situ sampling of sediment pore water, surface water, and groundwater. Under in situ conditions, samplers are deployed in the field and retrieved after the required deployment timeframe. For ex situ sampling, the media of interest is collected, brought back to a laboratory setting, and the samplers are deployed into the collected media. There are advantages and disadvantages to both in situ and ex situ sampling methods. For in situ, environmental conditions for the exposure period are maintained and any confounding factors introduced by moving to the laboratory are eliminated. However, there are logistic challenges that accompany in situ deployments, including loss of samplers. For ex situ sampling, exposure conditions can be controlled and time to equilibrium can be accelerated through mixing or agitation of the media in a laboratory setting. However, site-specific environmental factors that could influence the concentrations of analytes could be altered and thus influence results.
For sediment pore water characterization, deployment and retrieval of polymeric passive samplers is most easily performed in shallow or intertidal environments when done in situ. Samplers can also be deployed in deeper water, but typically require the use of a dive team to assist in deployment and retrieval. Ex situ sampling only requires the collection of sediment using a core or grab.
The components necessary to assemble PUF-PAS, such as PUF disks and protective stainless steel housings, are commercially available from several suppliers. Prior to field deployment, the PUF disks need to be precleaned to remove any background contaminants, which is typically done using Soxhlet extraction. Precleaned PUF disks can be obtained from suppliers. PUF disks are sometimes spiked with PRCs such as isotope-labeled chemicals or congeners rarely found in the environment to help quantify the fraction of equilibrium at different sampling locations ( Huckins et al. 2002 [DN3HJ22M] Huckins, James N., Jimmie D. Petty, Jon A. Lebo, et al. 2002. “Development of the Permeability/Performance Reference Compound Approach for in Situ Calibration of Semipermeable Membrane Devices.” Environmental Science & Technology 36 (1): 85–91. https://doi.org/10.1021/es010991w. ). Unexposed PUF-PAS should be used for QA/QC to assess background contamination introduced during the precleaning processes, transport, and deployment/retrieval. The PUF disk is usually housed in a protective stainless steel casing, and there are different casing designs available ( Melymuk et al. 2021 [M2BMRBJC] Melymuk, Lisa, Pernilla Bohlin Nizzetto, Tom Harner, et al. 2021. “Global Intercomparison of Polyurethane Foam Passive Air Samplers Evaluating Sources of Variability in SVOC Measurements.” Environmental Science & Policy 125 (November): 1–9. https://doi.org/10.1016/j.envsci.2021.08.003. ). PUF-PAS for air sampling are often mounted on poles, tripods, or other structures to position PUF-PAS at an optimum height (usually 1.5–2.0 m from the ground) to avoid influence from the ground. After the predetermined deployment period (usually weeks to months), PUF-PAS are retrieved from the sampling site, and PUF disks are carefully removed from the protective housing using a gloved hand and tweezers and sent for analysis. Prior to chemical extraction, PUF disks are spiked with a recovery standard to assess the integrity of the samples. Then PUF disks are extracted in a Soxhlet apparatus for 24 hours using a solvent.
The five polymetric sampling devices discussed all have different sampling capabilities (Table 5-4). The laboratory should always be contacted with questions prior to sampling.
Table 5-4: Polymeric sampler applications
5.2.7.3 Advantages
Applicable to POM, SPME, LDPE, and PDMS samplers:
- These samplers measure the bioavailable fraction of organic chemicals, providing a more accurate representation of the fraction of contaminant available for uptake by benthic and aquatic organisms.
- They can be performed in situ or ex situ.
- Use of PRCs allows for correction to equilibrium for more hydrophobic contaminants or time-constricted deployments.
- These samplers combine water sampling, extraction, and concentration.
- They measures time-averaged concentrations.
- There are low detection limits for more hydrophobic compounds.
- They cause minimal impact on sampling matrix and interferences with dissolved organic matter.
- They allow high resolution profiling of sediment pore water concentrations.
Applicable to PUF-PAS sampler:
- The components necessary to assemble PUF-PAS are commercially available.
- A standard PUF or modified PUF can be used to collect a wide range of SVOCs and POPs.
- PUF-PAS can also accumulate chemicals associated with particulates over time.
5.2.7.4 Limitations
Applicable to POM, SPME, LDPE, and PDMS samplers:
- These samplers are limited to hydrophobic contaminants.
- No published standard method is currently available, but numerous studies have been conducted to standardize methods.
- POM requires extended equilibration time.
- These samplers are commercially available, but on a limited basis. Several academic institutions produce and analyze passive samplers, and commercial availability is anticipated to grow.
Applicable to PUF-PAS sampler:
- The sampling rates for target chemicals at different sites may vary due to the influence of temperature and wind speed. The sampling rates need to be calibrated under specific site conditions to ensure accurate quantitative data.
- Airborne particulates can cause significant differences in estimating air concentration of target organic chemicals in gaseous phase.
5.2.8 Passive In Situ Concentration Extraction Sampler (PISCES)
5.2.8.1 Description and Application
The passive in situ concentration extraction sampler (PISCES) (Figure 5-24) is intended to sample nonpolar or HOCs in surface water ( Belluomini et al. 2008 [HM2SQ6CJ] Belluomini, Steve, Kathleen Considine, Bill Owen, and John Woodling. 2008. “Representative Sampling of Groundwater for Hazardous Substances: Guidance Manual for Groundwater Investigations.” California Environmental Protection Agency. https://dtsc.cdev.sites.ca.gov/wp-content/uploads/sites/112/2018/09/Representative_Sampling_of_GW_for_Haz_Subst.pdf. ). The sampler relies on diffusion and absorption to accumulate the target chemicals in the sampling medium ( Belluomini et al. 2008 [HM2SQ6CJ] Belluomini, Steve, Kathleen Considine, Bill Owen, and John Woodling. 2008. “Representative Sampling of Groundwater for Hazardous Substances: Guidance Manual for Groundwater Investigations.” California Environmental Protection Agency. https://dtsc.cdev.sites.ca.gov/wp-content/uploads/sites/112/2018/09/Representative_Sampling_of_GW_for_Haz_Subst.pdf. ). The residence period is compound-specific and can range from one day to one month. The rugged construction allows the sampler to be deployed for extended periods of time.
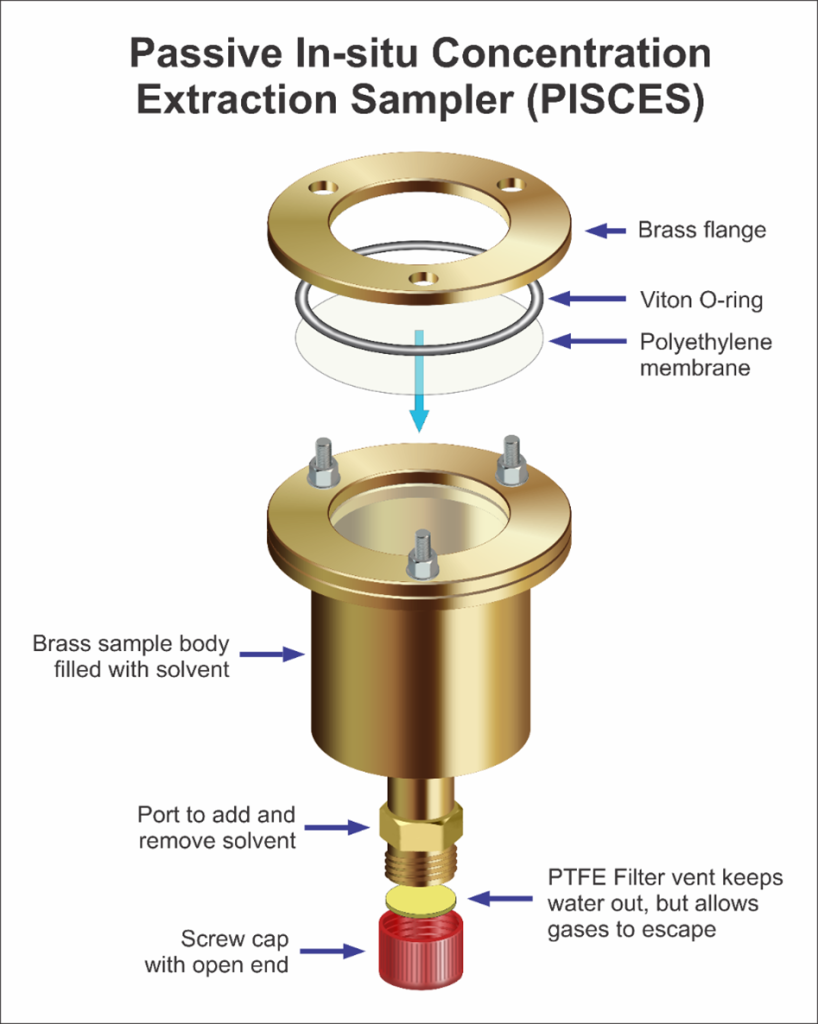
Figure 5-24. Passive in situ concentration extraction sampler (PISCES).
Source: NJDEP, figure used with permission.
PISCES consist of a membrane, typically LDPE, covering one end of a metal container filled with an organic solvent, typically hexane or isooctane (2,2,4-trimethylpentane) ( Belluomini et al. 2008 [HM2SQ6CJ] Belluomini, Steve, Kathleen Considine, Bill Owen, and John Woodling. 2008. “Representative Sampling of Groundwater for Hazardous Substances: Guidance Manual for Groundwater Investigations.” California Environmental Protection Agency. https://dtsc.cdev.sites.ca.gov/wp-content/uploads/sites/112/2018/09/Representative_Sampling_of_GW_for_Haz_Subst.pdf. ). Other solvents such as alcohols (methanol, ethanol, propanol) were evaluated for use in this technology. Chemical uptake is propelled by the preferential partitioning of nonionic organic chemicals from water to the solvent ( Belluomini et al. 2008 [HM2SQ6CJ] Belluomini, Steve, Kathleen Considine, Bill Owen, and John Woodling. 2008. “Representative Sampling of Groundwater for Hazardous Substances: Guidance Manual for Groundwater Investigations.” California Environmental Protection Agency. https://dtsc.cdev.sites.ca.gov/wp-content/uploads/sites/112/2018/09/Representative_Sampling_of_GW_for_Haz_Subst.pdf. ). For hydrophobic compounds, partition coefficients are large (greater than 1,000), and sampling continues at a constant rate for weeks to months without approaching equilibrium between the solvent and the water. The solvent is analyzed by conventional analytical methods. The membrane excludes ionic, high molecular-weight natural organic matter, and particulates, thereby simplifying, and in some cases eliminating, the need for cleanup of samples before analysis.
LDPE membranes typically are between 150 and 700 μm thick. The solvents pass through the membrane at an appreciable rate if the membrane is properly mounted and not damaged. Sampling rate does not differ between hexane or isooctane. Hexane extracts are more easily concentrated by evaporation, and more volatile compounds can be separated from hexane and analyzed by gas chromatography; however, hexane is more flammable than isooctane, presenting a greater hazard to field crews and individuals who might tamper with samplers in the field. Isooctane extracts are more difficult to concentrate by evaporation, requiring vacuum distillation if a boiling water bath is used as the heat source. Because of the lower fire hazard, isooctane is the recommended solvent unless volatile chemicals such as xylenes are to be analyzed.
PISCES are reusable and allow the easy addition and retrieval of the selected organic solvent, which is placed in the brass body (see Figure 5-24). The top cap of the sampler is fitted with a flange and Viton O-ring to retain the LDPE membrane. A port with a screw cap is at the other end to allow addition and removal of solvent. The PTFE vent filter on the top cap prevents the migration of the sample media from entering the sampler but allows gases that may accumulate during deployment to escape. PISCES are manufactured in two sizes: a 7.6-cm (3-inch) flange diameter (has a membrane area of 21 cm2 and can hold 100 mL of solvent), and a 10-cm (4-inch) flange diameter (has a membrane area of 50 cm2 and can hold 200 mL of solvent). Both samplers are approximately 9.5 cm (3.75 inches) long.
5.2.8.2 Installation and Use
The PISCES device is assembled in the laboratory and transported to the sampling site empty. Samplers are filled with solvent immediately before placing in the water to minimize evaporative loss of solvent through the membrane. Usually, samplers are suspended from an anchored float. Samplers have been deployed as deep as 20 m (66 ft) without problems and can likely be used much deeper. In areas prone to vandalism or other tampering, floats can be anchored below the water surface to make them less visible. In shallow water, samplers can be directly attached to a cinder block and placed on the bottom.
At the end of the deployment, solvent is decanted from the sampler into the laboratory-supplied container at the sampling site and returned to the laboratory for analysis. If time-series extracts are being collected, the sampler can be refilled with solvent at the sampling site and placed back in the water.
PISCES are designed as surface water samplers. They are not suitable for air sampling using hexane or isooctane as solvents because of vaporization of the solvents through the membrane. Quantitative application can typically be achieved in aqueous media where the water can be considered a source of chemical concentrations.
The uptake of compounds by PISCES is characterized by the sampling rate. The sampling rate is the volume of water that is cleared of chemical per unit time. Typical sampling rates are 1-4 L/day for lakes. Rates increase with membrane area, temperature, and water agitation and decrease slightly at salinities up to seawater. Under very turbulent conditions, sampling rates approaching 20 L/day have been observed in the laboratory.
Typically, more than 100 L of water is sampled for a one-month exposure. This yields a 100-fold decrease in detection limit relative to the traditional approach of grab sampling and extraction of a 1-liter water sample.
5.2.8.3 Advantages
- PISCES samplers can be redeployed without decontamination to the same sample location.
- They are lightweight.
- They are reusable.
- They have improved laboratory detection limits.
- PISCES allow easy addition and retrieval of solvent.
5.2.8.4 Limitations
- PISCES samplers are expensive.
- Samplers must remain submerged during deployment.
- Deployment to moving bodies of surface water requires careful consideration to avoid damage.
- Samplers may contain solvent that potentially could be released to sampled media.
- Some hazardous shipping and handling requirements may apply.
- Many laboratories do not accept these samplers for analysis.
5.2.9 Ceramic Diffusion Sampler/Ceramic Dosimeter
5.2.9.1 Description and Application
The ceramic diffusion sampler consists of a porous ceramic cup filled with reagent water with a PTFE or stainless steel cap. Target chemicals in the bulk water phase diffuse into the sampler through micropores (that is, a few microns pore size) in the ceramic cup and equilibrate with the water inside the sampler over time. Therefore, the ceramic diffusion sampler (Figure 5-25) is an equilibrium-type passive sampler and works the same as other equilibrium-type passive samplers such as the rigid porous polyethylene sampler. The sampler can be used to measure SVOCs and hydrophobic organic compounds such as PAHs in groundwater, surface water, and pore water ( Gefell et al. 2018 [T2JNM6RC] Gefell, M. J., M. Kanematsu, D. Vlassopoulos, and D. S. Lipson. 2018. “Aqueous-Phase Sampling with NAPL Exclusion Using Ceramic Porous Cups.” Groundwater 56: 847–51. ). The ceramic cup is inert, water-wet (hydrophilic), and does not adsorb or swell target chemicals. A major advantage of the ceramic diffusion sampler is that it allows the collection of aqueous media while excluding NAPL ( Gefell et al. 2018 [T2JNM6RC] Gefell, M. J., M. Kanematsu, D. Vlassopoulos, and D. S. Lipson. 2018. “Aqueous-Phase Sampling with NAPL Exclusion Using Ceramic Porous Cups.” Groundwater 56: 847–51. ). Aqueous-phase sampling can be complicated when NAPL is present in aqueous media. NAPL contained in water samples biases the interpreted aqueous concentrations unrealistically high. NAPLs also preferentially coat and foul polymeric sampling devices and complicates the determination of freely dissolved concentrations ( Ghosh et al. 2014 [T8GHY3EM] Ghosh, Upal, Susan Kane Driscoll, Robert M. Burgess, et al. 2014. “Passive Sampling Methods for Contaminated Sediments: Practical Guidance for Selection, Calibration, and Implementation.” Integrated Environmental Assessment and Management 10 (2): 210–23. https://doi.org/10.1002/ieam.1507. ). The porous ceramic cup is permeable to allow water to diffuse into the sampler but also resistant to NAPL entry and acts as a capillary barrier to exclude NAPL.
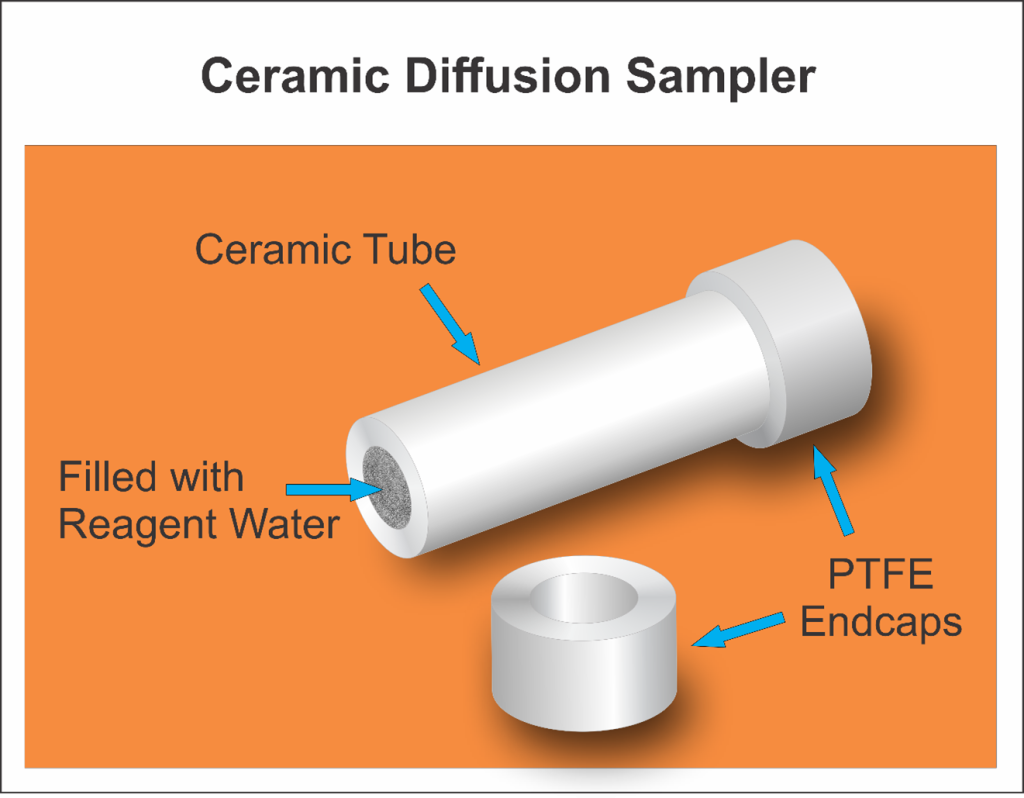
Figure 5-25. Ceramic diffusion sampler.
Source: NJDEP, figure used with permission.
The ceramic dosimeter (Figure 5-26) is similar to the ceramic diffusion sampler but functions differently. The ceramic dosimeter is made of a porous ceramic tube and solid adsorbent beads or resins enclosed in the ceramic tube ( Martin et al. 2003 [Q4MV5B7J] Martin, H., B. M. Patterson, and G. B. Davis. 2003. “Field Trial of Contaminant Groundwater Monitoring: Comparing Time-Integrating Ceramic Dosimeters and Conventional Water Sampling.” Environmental Science and Technology 37: 1360–64. https://pdfslide.net/documents/field-trial-of-contaminant-groundwater-monitoring-comparing-time-integrating.html?page=1. ). The ceramic dosimeter is used to measure VOCs, PAHs, and other organic chemicals in groundwater, surface water, and pore water ( Martin et al. 2003 [Q4MV5B7J] Martin, H., B. M. Patterson, and G. B. Davis. 2003. “Field Trial of Contaminant Groundwater Monitoring: Comparing Time-Integrating Ceramic Dosimeters and Conventional Water Sampling.” Environmental Science and Technology 37: 1360–64. https://pdfslide.net/documents/field-trial-of-contaminant-groundwater-monitoring-comparing-time-integrating.html?page=1. ; Bopp et al. 2005 [RWJTD3C2] Bopp, S., W. Hansjorg, and K. Schirmer. 2005. “Time-Integrated Monitoring of Polycyclic Aromatic Hydrocarbons (PAHs) in Groundwater Using the Ceramic Dosimeter Passive Sampling Device.” Journal of Chromatography A 1072: 137–47. ; Bopp et al. 2007 [EGPHZ7JJ] Bopp, S., M. S. Mclachlan, and K. Schirmer. 2007. “Passive Sampler for Combined Chemical and Toxicological Long-Term Monitoring of Groundwater: The Ceramic Toximeter.” Environmental Science and Technology 41: 6868–76. ; Bonifacio et al. 2017 [LQ5BK3YL] Bonifacio, R. G., G. U. Nam, Y. S. Hong, and I. Y. Eom. 2017. “Development of Solid Ceramic Dosimeters for the Time-Integrative Passive Sampling of Volatile Organic Compounds in Waters.” Environmental Science and Technology 51: 12557–65. ). A ceramic tube acts as diffusive-controlling layer for target chemicals, and the enclosed solid adsorbents or resins adsorb target chemicals. PTFE caps are used to close a ceramic tube to minimize sorption of target chemicals, and those caps are fixed in a stainless steel holder ( Martin et al. 2003 [Q4MV5B7J] Martin, H., B. M. Patterson, and G. B. Davis. 2003. “Field Trial of Contaminant Groundwater Monitoring: Comparing Time-Integrating Ceramic Dosimeters and Conventional Water Sampling.” Environmental Science and Technology 37: 1360–64. https://pdfslide.net/documents/field-trial-of-contaminant-groundwater-monitoring-comparing-time-integrating.html?page=1. ). The solid adsorbents or resins concentrate target organic chemicals diffused through the ceramic tube over time and eventually saturate if deployed for an extended period. The ceramic dosimeter works only at the kinetic regime, where the uptake rates of a target chemical to the sampler are linearly proportional to the difference between the chemical activity of the chemical in the bulk phase and that in the sampler. Therefore, the ceramic dosimeter is an accumulation-type sampler, whereas the ceramic diffusion sampler is an equilibrium-type sampler.
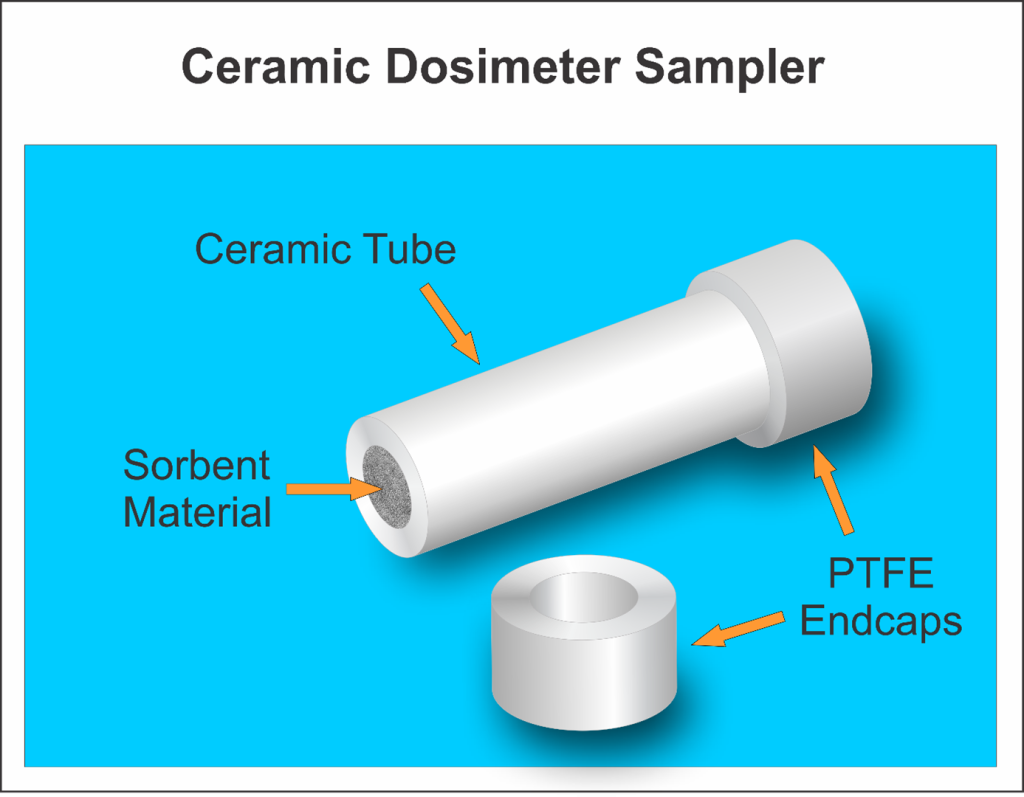
Figure 5-26. Ceramic dosimeter sampler.
Source: NJDEP, figure used with permission.
Martin, Patterson, and Davis ( Martin et al. 2003 [Q4MV5B7J] Martin, H., B. M. Patterson, and G. B. Davis. 2003. “Field Trial of Contaminant Groundwater Monitoring: Comparing Time-Integrating Ceramic Dosimeters and Conventional Water Sampling.” Environmental Science and Technology 37: 1360–64. https://pdfslide.net/documents/field-trial-of-contaminant-groundwater-monitoring-comparing-time-integrating.html?page=1. ) showed that the relationship between the time-weighted average concentration of a target chemical and the accumulated mass on the solid adsorbent beads is based on Fick’s first law as follows (Equation 4):
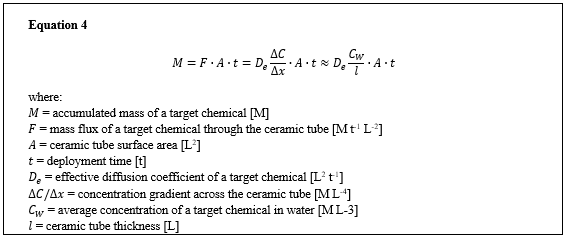
Maintaining the concentration of the solute inside the sampler as close to zero as possible will allow a time-weighted concentration to be calculated from the accumulated mass. This is accomplished through the addition of high-capacity adsorbent beads inside the tube. These beads ensure the linear uptake of the target compound during the entire deployment time. Comparison between the concentrations derived from ceramic dosimeters and average concentrations determined by frequent conventional snapshot active sampling showed that ceramic dosimeters perform well over up to 90 days of deployment in a contaminated aquifer ( Martin et al. 2003 [Q4MV5B7J] Martin, H., B. M. Patterson, and G. B. Davis. 2003. “Field Trial of Contaminant Groundwater Monitoring: Comparing Time-Integrating Ceramic Dosimeters and Conventional Water Sampling.” Environmental Science and Technology 37: 1360–64. https://pdfslide.net/documents/field-trial-of-contaminant-groundwater-monitoring-comparing-time-integrating.html?page=1. ).
In a recent study, Kaserzon et al. ( Kaserzon et al. 2019 [7SEEAA3S] Kaserzon, Sarit L., Soumini Vijayasarathy, Jennifer Bräunig, et al. 2019. “Calibration and Validation of a Novel Passive Sampling Device for the Time Integrative Monitoring of Per- and Polyfluoroalkyl Substances (PFASs) and Precursors in Contaminated Groundwater.” Journal of Hazardous Materials 366 (March): 423–31. https://doi.org/10.1016/j.jhazmat.2018.12.010. ) used a microporous polyethylene tube instead of using a porous ceramic tube as a diffusion-controlling layer to enclose an anion exchange resin (Strata X-AW) to measure per- and polyfluoroalkyl substances (PFAS) in aqueous media. The use of ceramic materials for PFAS may be problematic due to the adsorption of PFAS on ceramics, but polyethylene materials are suitable to measure PFAS ( Kaserzon et al. 2019 [7SEEAA3S] Kaserzon, Sarit L., Soumini Vijayasarathy, Jennifer Bräunig, et al. 2019. “Calibration and Validation of a Novel Passive Sampling Device for the Time Integrative Monitoring of Per- and Polyfluoroalkyl Substances (PFASs) and Precursors in Contaminated Groundwater.” Journal of Hazardous Materials 366 (March): 423–31. https://doi.org/10.1016/j.jhazmat.2018.12.010. ).
5.2.9.2 Installation and Use
As described above, the ceramic diffusion sampler can be placed in NAPL-contaminated aqueous media to equilibrate by diffusion to measure SVOCs and PAHs while excluding NAPL. This is a unique feature of this technology as NAPL exclusion is quite difficult for other passive samplers. It takes approximately 30 days for PAHs to reach equilibrium between the water inside the sampler and the surrounding aqueous phase under a static condition ( Gefell et al. 2018 [T2JNM6RC] Gefell, M. J., M. Kanematsu, D. Vlassopoulos, and D. S. Lipson. 2018. “Aqueous-Phase Sampling with NAPL Exclusion Using Ceramic Porous Cups.” Groundwater 56: 847–51. ).
Different solid adsorbent beads have been used in ceramic dosimeters to measure a variety of organic compounds, such as VOCs, PAHs, dioxins, flame retardants, and pharmaceutical compounds ( Addeck et al. 2012 [MVIQABXJ] Addeck, A., K. Croes, K. Langenhove, M. Denison, M. Elskens, and W. Baeyens. 2012. “Dioxin Analysis in Water by Using a Passive Sampler and CALUX Bioassay.” Talanta 88: 73–78. ; Franquet-Griell et al. 2017 [L4EY5QC9] Franquet-Griell, H., V. Pueyo, J. Silva, V. M. Orera, and S. Lacorte. 2017. “Development of a Macroporous Ceramic Passive Sampler for the Monitoring of Cytostatic Drugs in Water.” Chemosphere 182: 681–90. ; Cristale et al. 2013 [ACH7B6JJ] Cristale, J., A. Katsoyiannis, C. Chen, K. C. Jones, and S. Lacorte. 2013. “Assessment of Flame Retardants in River Water Using a Ceramic Dosimeter Passive Sampler.” Environmental Pollution 172: 163–69. ; Kaserzon et al. 2019 [7SEEAA3S] Kaserzon, Sarit L., Soumini Vijayasarathy, Jennifer Bräunig, et al. 2019. “Calibration and Validation of a Novel Passive Sampling Device for the Time Integrative Monitoring of Per- and Polyfluoroalkyl Substances (PFASs) and Precursors in Contaminated Groundwater.” Journal of Hazardous Materials 366 (March): 423–31. https://doi.org/10.1016/j.jhazmat.2018.12.010. ). The ceramic dosimeters are deployed in aqueous media for a few weeks or months to uptake target chemicals, and the deployment duration may vary depending on target chemicals. Solid adsorbent beads are extracted a few times with organic solvents such as acetone after retrieval to determine the accumulated mass of a target compound. Once adsorbed, certain chemicals do not significantly degrade, desorb, or diffuse out of the ceramic dosimeter ( Martin et al. 2003 [Q4MV5B7J] Martin, H., B. M. Patterson, and G. B. Davis. 2003. “Field Trial of Contaminant Groundwater Monitoring: Comparing Time-Integrating Ceramic Dosimeters and Conventional Water Sampling.” Environmental Science and Technology 37: 1360–64. https://pdfslide.net/documents/field-trial-of-contaminant-groundwater-monitoring-comparing-time-integrating.html?page=1. ). The ceramic dosimeter can be combined with bioassay and biomonitoring by using a unique solid adsorbent material; this technique is called a ceramic toximeter ( Bopp et al. 2007 [EGPHZ7JJ] Bopp, S., M. S. Mclachlan, and K. Schirmer. 2007. “Passive Sampler for Combined Chemical and Toxicological Long-Term Monitoring of Groundwater: The Ceramic Toximeter.” Environmental Science and Technology 41: 6868–76. ; Addeck et al. 2012 [MVIQABXJ] Addeck, A., K. Croes, K. Langenhove, M. Denison, M. Elskens, and W. Baeyens. 2012. “Dioxin Analysis in Water by Using a Passive Sampler and CALUX Bioassay.” Talanta 88: 73–78. ). Bonifacio et al. ( Bonifacio et al. 2017 [LQ5BK3YL] Bonifacio, R. G., G. U. Nam, Y. S. Hong, and I. Y. Eom. 2017. “Development of Solid Ceramic Dosimeters for the Time-Integrative Passive Sampling of Volatile Organic Compounds in Waters.” Environmental Science and Technology 51: 12557–65. ) used a nonporous ceramic tube that excluded the permeation of water but allowed only gas-phase diffusion of VOCs to the dry resin inside the ceramic tube and showed its effectiveness to measure VOC concentrations in water.
5.2.9.3 Advantages
- Ceramic materials can exclude NAPL from water samples.
- A ceramic dosimeter can achieve better detection limits for VOCs compared to grab- and equilibrium-based passive samplers because of the accumulation of those compounds on solid adsorbent beads.
- A wide range of organic compounds may be measured by using different solid adsorbent beads inside the ceramic dosimeter.
5.2.9.4 Limitations
- The ceramic diffusion sampler and ceramic dosimeter are not commercially available. However, users can construct these samplers using commercially available porous ceramic cups/tubes and other parts.
- Ceramic dosimeters and ceramic equilibrium samplers cannot be used for inorganic compounds and PFAS because of the uptake of those chemicals by ceramic materials.
- The ceramic dosimeter is still in the development phase and requires extra steps to determine aqueous phase concentrations compared to grab or equilibrium passive samplers.
- PTFE parts may contain PFAS, which should be considered based on project DQOs.
5.3 Accumulation Sampling Technologies
Accumulation (integrative) devices function in liquid and gas media where molecules freely move about within the medium under naturally occurring conditions of molecular motion, thermal convection, and flow. They concentrate the target chemical on a selective collecting medium such as an adsorbent or absorbent solid, a solvent, or chemical reagent (ITRC 2022).
The collecting medium may be in direct contact with the sampled medium. For example, ambient air being sampled may be in direct contact with the adsorptive granular solid material, such as granular activated carbon, in the device. Alternatively, the collecting medium may be contained within a semipermeable membrane so that only certain molecules can diffuse from the sampled medium, through the membrane, and into contact with the collecting medium. For example, an absorbent gel may be contained within a hydrophobic membrane so that when immersed in water the membrane prevents water molecules from coming in direct contact with the collecting gel but it allows diffusion of specific contaminant molecules through the membrane so they can be absorbed by the gel.
Target molecules that come in contact with the collecting medium accumulate on the collecting medium during the exposure period, at compound-specific uptake rates that are influenced by environmental conditions (including temperature, pressure, flow rate past the sampler, and turbulence of the sampled environment), depending on the medium sampled. The target molecules will continue to accumulate on the collecting medium until the medium reaches saturation; therefore, the collecting medium needs to be of sufficient mass so that a concentration equilibration with the surrounding medium does not occur. If the target medium becomes saturated before removal and analysis, the calculation of concentration will be biased low.
After the sampler has been recovered, the target molecules are desorbed from the collecting medium at a lab to produce a result of mass of accumulated target molecules. The resulting sample chemical mass is used to calculate a time-weighted average concentration of target chemicals over the exposure period ( Huckins et al. 2006 [6V87RUVQ] Huckins, James N., Jimmie D. Petty, and Kees Booji. 2006. Monitors of Organic Chemicals in the Environment Semipermeable Membrane Devices. Springer eBooks. https://doi.org/10.1007/0-387-35414-x. ; Taylor et al. 2021). Previously calculated uptake rates for the individual compounds are needed to calculate the mass accumulated to a time-weighted average concentration (µg/m3). Uptake rates are not flow rates and may have units of volume/time but are dependent on media for specific calculation. The longer the sampling duration, the more of the medium that is sampled and, therefore, the lower the reporting limit.
Time-weighted average concentrations of VOCs are collected over days or weeks on accumulation samplers to provide time-integrated measurements and average measurements over an extended sampling period. No pumps or vacuums are used, so the reported measurement represents a concentration under ambient conditions. The sampling protocols are simpler than traditional sampling methods, which reduces the cost of sampling and risk of operator error.
These longer, time-integrated samples are a preferred approach for determining both short-term and long-term average exposure levels. As noted in the USEPA Office of Solid Waste and Emergency Response (OSWER) Vapor Intrusion Guidance says, “All else being equal, a longer collection period for each individual sample would be expected to yield a more reliable basis for estimating long-term [and short-term], time-average exposure than would a one-day sample collection period” ( USEPA 2015 [ZH2YKUR7] USEPA. 2015. “OSWER Technical Guide For Assessing and Mitigating the Vapor Intrusion Pathway from Subsurface Vapor Sources to Indoor Air.” USEPA, Office of Solid Waste and Emergency Response, June. https://www.epa.gov/sites/default/files/2015-09/documents/oswer-vapor-intrusion-technical-guide-final.pdf. ). Passive samplers have the additional benefit of being small, lightweight, easy to ship, and easy to use with simple sampling protocols not requiring specialized training.
As part of the data evaluation of a passive sample collected over an extended time period, inferences can be made of what the highest concentration may have been for any shorter time period within the total sampling time. As an example, a trichloroethene (TCE) measurement of 1.0 μg/m3 recorded over a 10-day sampling period also means that the highest 2-day (48 hour) average concentration could not have exceeded 5 µg/m3 or the highest 1-day (24 hour) average concentration could not have exceeded 10 μg/m3.
Although this document mentions several passive accumulation samplers by name, it should be noted that there are other companies providing sorbent samplers for the collection of soil gas and/or indoor/outdoor air samples. Typically, these samplers consist of a sorbent material held in either a stainless steel or glass tube or within a “housing.” The adsorbent materials in these tubes are chosen based on the target analytes and the analytical extraction method to be used (for example, thermal desorption or solvent extraction). Frequently used adsorbents include, but are not limited to Anasorbs, Carbosieves, Carbopack X, Carbograph, Carboxens, Chromosorbs, Tenax TA, XADs, and silica gels. These sorbent tubes, depending on the sorbent material and target chemicals, can be analyzed by USEPA Methods TO-17 or 325A. When using passive sampling methods for the collection of air and/or soil gas samples, be sure to consider all of the different samplers and sorbent options that may be applicable for sampling the target chemicals.
Table 5-5, adapted from USGS’s Table 4 ( Imbrigiotta and Harte 2020 [9LSVPE48] Imbrigiotta, Thomas, and Philip Harte. 2020. “Passive Sampling of Groundwater Wells for Determination of Water Chemistry.” In U.S. Geological Survey Techniques and Methods. https://doi.org/10.3133/tm1d8. ), below lists chemical families that can be analyzed using the noted passive sampling technologies. Always check with your state agency, sampler manufacturer, and laboratory to confirm that the selected technology meets your DQOs.
| Passive Accumulation Sampling Technologies | AGI | POCIS | Sentinel | SPMD | DGT | Min- Trap |
Radiello | Waterloo | Beacon | Dart | Fossil Fuel |
Bio- Trap |
|---|---|---|---|---|---|---|---|---|---|---|---|---|
| Chemical constituents and characteristics | ||||||||||||
| Field physiochemical characteristics (Temp, pH, SC, DO, ORP) |
N/A | N/A | N/A | N/A | N/A | N/A | N/A | N/A | N/A | N/A | N/A | N/A |
| Major cations and anions (Ca, Mg, Na, K, HCO3, Cl, SO4, F, Br) |
N/A | N/A | N/A | N/A | Some | N/A | N/A | N/A | N/A | N/A | N/A | N/A |
| Nutrients (NO3, NO2, NH4, PO4) |
N/A | N/A | N/A | N/A | Some (NO3, PO4) | N/A | N/A | N/A | N/A | N/A | N/A | N/A |
| Trace elements (metals) (Fe, Mn, Al, Ag, Zn and others) |
N/A | N/A | N/A | N/A | ALL | N/A | N/A | Some (Hg) | Hg | N/A | N/A | N/A |
| Perchlorate (ClO4) | N/A | N/A | N/A | N/A | N/A | N/A | N/A | N/A | N/A | N/A | N/A | N/A |
| Organic carbon (dissolved or total) |
N/A | N/A | N/A | N/A | N/A | N/A | N/A | N/A | N/A | N/A | petrogenic CO2 in soil (via measurements of total and modern (based on 14C)) | N/A |
| Dissolved hydrocarbon gases (Methane, ethane, ethene) |
N/A | N/A | N/A | N/A | N/A | N/A | N/A | N/A | N/A | N/A | N/A | N/A |
| Volatile organic compounds (Chlorinated solvents, BTEX) |
Some | N/A | N/A | N/A | N/A | N/A | Some | Some | Most | N/A | N/A | N/A |
| Semivolatile organics (1,4-dioxane, BN, phenols, PAH, PCB, dioxins, furans) |
Some | N/A | N/A | Some | N/A | N/A | Some | Some | Some (PAH) | N/A | N/A | |
| Pesticides, herbicides, and fungicides (organoCl, organoPO4) |
Some | ALL | N/A | Some | Some (Organic PO4) | N/A | N/A | N/A | Some | N/A | N/A | N/A |
| Explosive compounds (RDX, HMX, TNT) |
Some | N/A | N/A | NT | NT | N/A | N/A | N/A | Some | N/A | N/A | N/A |
| Poly- and perfluoroalkyl substances (PFASs) |
NT | Some | Some | NT | Some | N/A | N/A | N/A | Some | N/A | N/A | N/A |
| Pharmaceuticals (Drugs, fragrances, hormones) |
N/A | ALL | N/A | Some | Some | N/A | N/A | N/A | NT | N/A | N/A | N/A |
| Minerals (pyrite, mackinawite, iron compounds) |
N/A | N/A | N/A | N/A | N/A | ALL | N/A | N/A | N/A | N/A | N/A | N/A |
| Microbial population sampling (e.g., Dehalococcoides) |
N/A | N/A | N/A | N/A | N/A | Some | N/A | N/A | N/A | N/A | N/A | ALL |
| Table 5-5 Key | |
|---|---|
| Most | Most compounds are compatible with the sampler |
| Some | Some compounds are compatible with the sampler |
| NT | Not tested (no study to support) |
| N/A | Not applicable to this sampler |
| Table 5-5 Acronym Key |
|---|
| [Temp, temperature; SC, specific conductivity; DO, dissolved oxygen; ORP, oxidation-reduction potential; Ca, calcium; Mg, magnesium; Na, sodium; K, potassium; HCO3, bicarbonate; Cl, chloride; SO4, sulfate; F, fluoride; Br, bromide; NO3, nitrate, NO2, nitrite; NH4, ammonium; PO4, phosphate; Fe, iron; Mn, manganese; Al, aluminum; Ag, silver; Zn, zinc; ClO4, perchlorate; BTEX, benzene, toluene, ethylbenzene and xylene; BN, base-neutral organics; PAH, polycyclic aromatic hydrocarbons; PCB, polychlorinated biphenyls; organoCl, organochlorine; organoP04, organophosphate; RDX, 1,3,5-trinitro-1,3,5-triazinane; HMX, 1,3,5,7-tetranitro-1,3,5,7-tetrazoctane; TNT, trinitrotoluene; TOC, total organic carbon; Hg, mercury; CO2, carbon dioxide] |
5.3.1 AGI Universal Sampler (Formerly the Gore Sorber)
5.3.1.1 Description and Applications
The Amplified Geochemical Imaging (AGI) Universal Sampler (Figure 5-27) is a device that relies on diffusion and adsorption to accumulate chemicals on the “passive sorbent collection units (‘sorbers’)” contained within the sampler (or module). These modules yield a chemical mass that reportedly can then be correlated with concentrations of said chemicals in water or air. This device can be used to sample soil gas in the vadose zone, indoor/outdoor air for vapor intrusion studies, and dissolved organic chemicals in either saturated soils or groundwater monitoring wells. AGI samplers can be used in both fresh and saltwater environments, including marsh sediments, streams, river embankments, and coastal settings ( Belluomini et al. 2008 [HM2SQ6CJ] Belluomini, Steve, Kathleen Considine, Bill Owen, and John Woodling. 2008. “Representative Sampling of Groundwater for Hazardous Substances: Guidance Manual for Groundwater Investigations.” California Environmental Protection Agency. https://dtsc.cdev.sites.ca.gov/wp-content/uploads/sites/112/2018/09/Representative_Sampling_of_GW_for_Haz_Subst.pdf. ).
Each module is approximately ¼ inch in diameter, 13 inches in length, and consists of a polytetrafluoroethylene (PTFE Gore-Tex) membrane tube that contains four connected sorber pockets holding engineered sorbent material. The PTFE Gore-Tex membrane is microporous, expandable, and relatively chemically inert ( Imbrigiotta and Harte 2020 [9LSVPE48] Imbrigiotta, Thomas, and Philip Harte. 2020. “Passive Sampling of Groundwater Wells for Determination of Water Chemistry.” In U.S. Geological Survey Techniques and Methods. https://doi.org/10.3133/tm1d8. ). A typical sorber pocket is about 25 mm in length, 3 mm in diameter, and contains a PTFE rod embedded with granular adsorbent material that is chosen based on the specific target compounds. Hydrophobic carbonaceous and polymeric resins are used for VOCs and SVOCs, but the adsorbent material can be custom designed for other chemicals. Organic compounds dissolved in water partition to the vapor phase (Henry’s Law) and move across the membrane to the sorbent ( Imbrigiotta and Harte 2020 [9LSVPE48] Imbrigiotta, Thomas, and Philip Harte. 2020. “Passive Sampling of Groundwater Wells for Determination of Water Chemistry.” In U.S. Geological Survey Techniques and Methods. https://doi.org/10.3133/tm1d8. ). The end of the module has a loop with a unique serial number label.
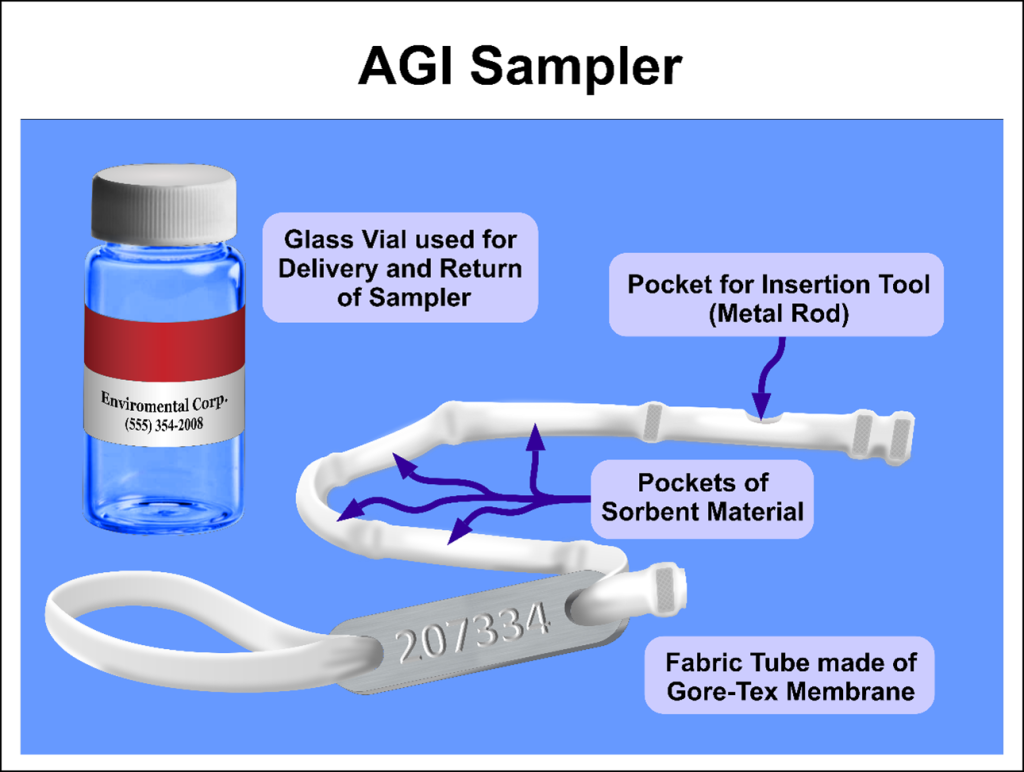
Figure 5-27. Amplified Geochemical Imaging Universal Sampler.
Source: NJDEP, figure used with permission.
5.3.1.2 Installation and Use
The AGI Universal Sampler (Figure 5-28 to 5-30) can be used to sample vadose zone soil gas, indoor/ outdoor air, and dissolved gases in groundwater. The modules arrive clean and contained in a sealed glass vial from the manufacturer. The samplers are provided as part of a sampling kit that includes additional installation supplies (see photos below), such as corks, string, stainless steel insertion rods, and chains of custody. Medium-specific installation and use is as follows:
Soil Gas Sampling
Field personnel advance a vertical boring using a slide hammer, rotary hammer drill, metal drive rod and hammer, or direct push drill rig. The standard soil gas survey kit provided by AGI is designed for a 36-inch vertical hole of 1/2-inch diameter. Should a project’s DQOs require deeper samples, AGI should be consulted during the planning phase of the investigation. Once the boring is advanced, the field personnel cut a 72-inch length of string (provided) and loop it through the eyelet of the cork. The AGI passive sampler is then removed from the glass vial, the string is threaded through the looped end, and a knot is tied to secure it. One of the stainless steel insertion rods (see Figure 5-28 is placed in the pocket of the sampler and both the rod and sampler are inserted into the boring. Note that the insertion rod is used only to assist in the sampler insertion process, providing rigidity to the otherwise flexible sampler. Using the insertion rod, the sampler is then pushed down to the target depth interval and the rod is detached (ideally by twisting it) and removed from the boring. Once the sampler is placed at the target depth interval, the cork, to which the string is attached, is used to seal/plug the boring. Once the sampler is deployed and the installation date and time are recorded, the samplers are left to passively collect for 7–10 days.
To retrieve, the field personnel remove the cork (by hand or with a screwdriver) and remove the sampler from the ground using the attached string. Once removed, the string is cut and the sampler is wiped clean using a clean cloth rag or paper towel and returned to the corresponding glass vial. All collected samples are then logged on to the chain of custody and shipped to AGI’s laboratory for analysis. AGI’s internal research has determined that, for all media sampled, the modules do not have to be kept cold for shipment ( AGI 2016 [EPIAEYWH] AGI. 2016. “Guidelines for Storage, Installation, and Retrieval of Air Sampling.” Amplified Geochemical Imaging LLC. https://agisurveys.net/wp-content/uploads/2020/04/Technical-pdf-7.1.pdf. ). Therefore, the modules can be kept in glass vials (without refrigeration) until they are analyzed by the laboratory (typically within 4–7 days).
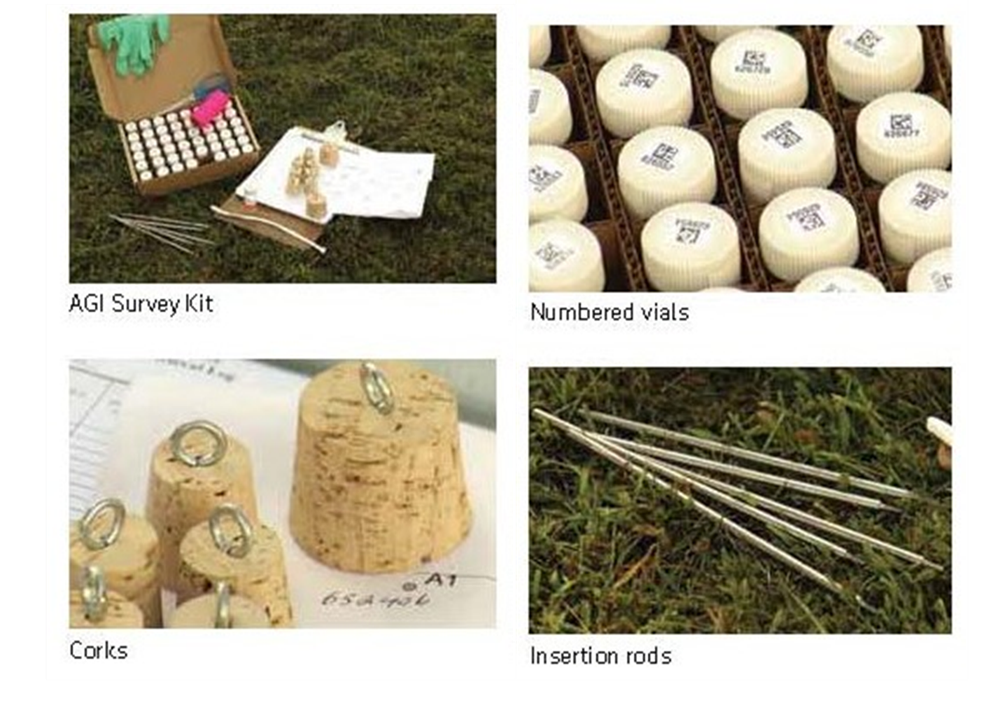
Figure 5-28. AGI sampler kit and components.
Source: AGI, used with permission.
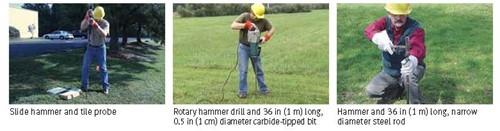
Figure 5-29. AGI sampler installation.
Source: AGI, used with permission.
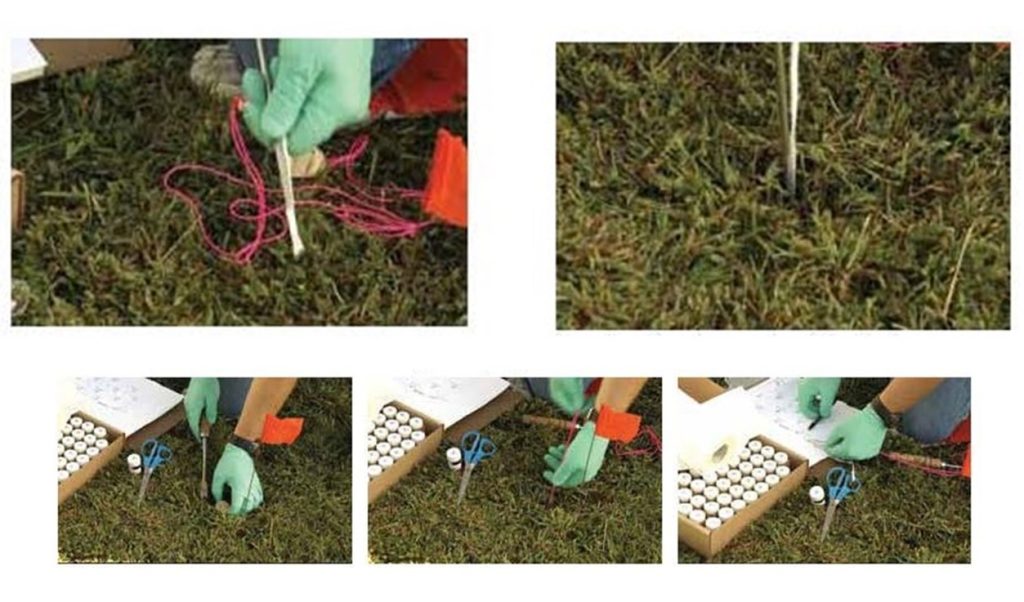
Figure 5-30. AGI sampler deployment and retrieval.
Source: AGI, used with permission.
Indoor/Outdoor Sampling
When using this device to collect indoor/outdoor air (Figure 5-31), the field personnel should decide on the appropriate method for installing the samplers in their desired locations and have the appropriate supplies (that is, precut pieces of string, nails, or pushpins) ready prior to the sampling event. On the day of sample deployment, the first step is selecting which samplers will be treated as trip blanks. These samplers are left in the kit unopened. Next, at each location, remove the sampler from its jar and re-seal the empty jar. The sampler is then attached to the sample location using the predetermined method. If string is used, tie the string to the sampler loop and then affix to the location. Once deployed, the sampler’s serial number, along with the date and time of installation, are recorded on the sampling log. Following the installation of all samplers, store the sample box that contains the trip blanks in a clean place, free from potential sources of organic vapors. After the samplers are allowed to passively collect for the desired time (which can range from several days to multiple months), each sampler is retrieved, the retrieval date and time are recorded, the attachment material is disposed of, and the samplers are returned to their appropriate vials. The vials are placed back into the sample box, the samples are logged on the chain of custody, and the box is shipped to AGI’s laboratory for analysis.
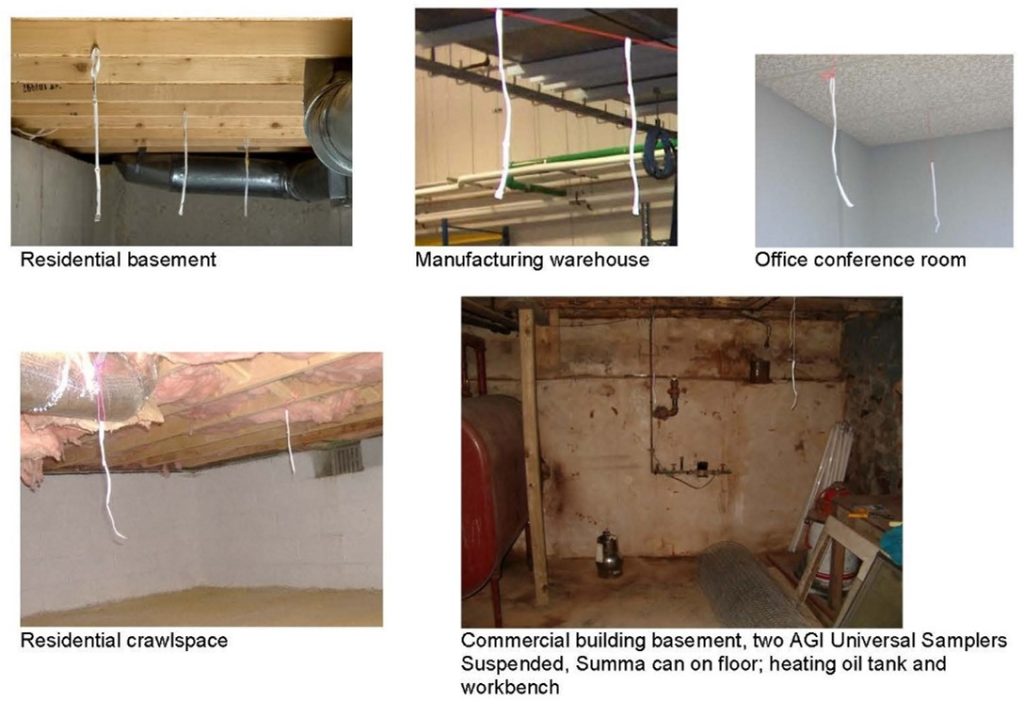
Figure 5-31. AGI samplers being used for indoor/outdoor air sampling.
Source: AGI, used with permission.
Groundwater Sampling
After removing the module from the vial, a line is attached to the module as described above and a weight is added to the end of the module to keep the module suspended in groundwater at the desired depth (typically in the screened interval). If warranted by a project’s DQOs, several modules can be placed at varying depths within a single well’s screened interval. After an exposure period of 15 minutes to 4 hours, the module is retrieved and returned to its glass vial, which is then placed in the shipping container. The glass vials containing the exposed modules, quality control samples (that is, trip blanks, equipment blanks, and/or duplicates), and chain of custody forms are shipped to AGI’s laboratory, typically via overnight courier for analysis (
AGI 2016 [EPIAEYWH] AGI. 2016. “Guidelines for Storage, Installation, and Retrieval of Air Sampling.” Amplified Geochemical Imaging LLC. https://agisurveys.net/wp-content/uploads/2020/04/Technical-pdf-7.1.pdf.
).
Deployment Time
The recommended exposure period for AGI passive adsorbents will depend on the matrix to which they are exposed and the adsorbent that is used. The adsorbents have different uptake rates, and they will reach equilibrium with their surroundings at different intervals. For instance, if the AGI passive adsorbents are used for indoor air sampling, they will reach equilibrium within a few hours (recommended exposure would be 3-4 hours). If they are placed in a monitoring well for detection of dissolved constituents, they will reach equilibrium within an hour or two. While in the vadose zone, detecting soil gases, equilibrium can be reached at either 3–5 days or 7–10 days, depnding on the absorbant.
5.3.1.3 Advantages
- When sampling groundwater, no purge water is generated.
- AGI passive samplers are applicable to a wide range of VOC and SVOC compounds.
- The can be placed in NAPL to sample.
- They are sensitive to parts per trillion levels.
- AGI passive samplers can be used in small-diameter piezometers or monitoring wells, sediments, surface water, springs, and other aqueous settings, regardless of their flow or turbidity.
- They have minimal shipping requirements (do not require ice or coolers) and reduced shipping costs.
- They have a short residence period for groundwater.
- Modules contain duplicate samples.
5.3.1.4 Limitations
- When used to measure dissolved gases in groundwater, data are reported in total mass desorbed, thereby requiring calibration with concentration measurements from standard groundwater samples in wells.
- The sampler contains a small amount of adsorbent that makes it prone to sorbent saturation when high concentrations are present.
- The melting point of PTFE is lower than the upper temperature limit of carbonaceous adsorbents, which may result in inefficient desorption of all compounds adsorbed (that is, irreversible adsorption).
- AGI passive samplers have a single source supplier and analysis laboratory.
- This technology cannot be used to measure field parameters.
- This technology cannot be used for inorganics.
- Compound detection is limited by vapor pressure.
- AGI passive samplers are not particularly feasible for vertical delineation in soil gas.
- Soil gas data may not be accepted for risk assessment purposes in most states.
- Some components of this sampler may contain PFAS, which should be considered based on project DQOs.
5.3.2 Polar Organic Chemical Integrative Sampler
5.3.2.1 Description and Application
The Polar Organic Chemical Integrative Sampler (POCIS) is designed to sample water-soluble (polar or hydrophilic) organic chemicals from aqueous environments. This device relies on diffusion and sorption to accumulate a total mass of chemicals. The residence period ranges from weeks to months. This device has no mechanical or moving parts. The POCIS samples chemicals from the dissolved phase, mimicking the respiratory exposure of aquatic organisms. The POCIS provides a reproducible means for monitoring contaminant levels and is unaffected by many environmental stressors such as dissolved oxygen levels, water quality, and high concentrations of toxic pollutants that affect biomonitoring organisms. The POCIS also concentrates trace organic chemicals for toxicity assessments and toxicity identification evaluation approaches.
The standard POCIS consists of a solid material (sorbent) contained between two microporous polyethersulfone (PES) membranes. The membranes have a pore size of 0.1 µm, which allows water and dissolved chemicals to pass through to the sorbent where the chemicals are trapped ( MacKeown et al. 2022 [HYI8DJZB] MacKeown, Henry, Emanuele Magi, Marina Di Carro, and Barbara Benedetti. 2022. “Unravelling the Role of Membrane Pore Size in Polar Organic Chemical Integrative Samplers (POCIS) to Broaden the Polarity Range of Sampled Analytes.” Analytical and Bioanalytical Chemistry 414 (5): 1963–72. https://doi.org/10.1007/s00216-021-03832-4. ). Larger materials, such as sediment and particulate matter, do not pass through the membrane ( Alvarez and Huckins 2004 [VK9IPYIJ] Alvarez, David, and Jim Huckins. 2004. “Polar Organic Chemical Integrative Sampler (POCIS).” USGS, November. https://www.cerc.usgs.gov/pubs/center/pdfdocs/pocis.pdf. ). The buildup of biofilms can be a rate-limiting step in the accumulation of chemicals by many membrane-based sampling devices. The PES membranes used in the POCIS have an inherent resistance to the buildup of biofilms, thereby reducing this potential impediment to uptake. Specific chemicals and chemical classes can be targeted by using different sorbent types. A standard POCIS has a sampling surface area (surface area of exposed membrane) to sorbent mass ratio of about 180 cm2/g ( Alvarez and Huckins 2004 [VK9IPYIJ] Alvarez, David, and Jim Huckins. 2004. “Polar Organic Chemical Integrative Sampler (POCIS).” USGS, November. https://www.cerc.usgs.gov/pubs/center/pdfdocs/pocis.pdf. ). Typically when deployed, POCIS can effectively sample a surface area of 41 cm2 ( Alvarez and Huckins 2004 [VK9IPYIJ] Alvarez, David, and Jim Huckins. 2004. “Polar Organic Chemical Integrative Sampler (POCIS).” USGS, November. https://www.cerc.usgs.gov/pubs/center/pdfdocs/pocis.pdf. ). Figure 5-32 depicts an exploded view of a single POCIS disk. The PES membranes must be secured with a compression ring system to prevent loss of sorbent because they are not compatible with standard sealing techniques (that is, heat sealing). Compression rings are typically constructed from stainless steel or another rigid inert material. Individual POCIS can be secured on a support rod or on a rack system for insertion in a protective deployment canister. The protective canister, usually made of stainless steel or PVC, deflects debris that may displace the POCIS array.
The most common sorbent used in the POCIS is Oasis HLB (Waters, Milford, MA). Depending on the chemicals of interest to be sampled, it may be desirable to use a different sorbent inside the POCIS. Weak anion exchange and molecularly imprinted polymers have been used in POCIS as the sequestration medium for specific applications.
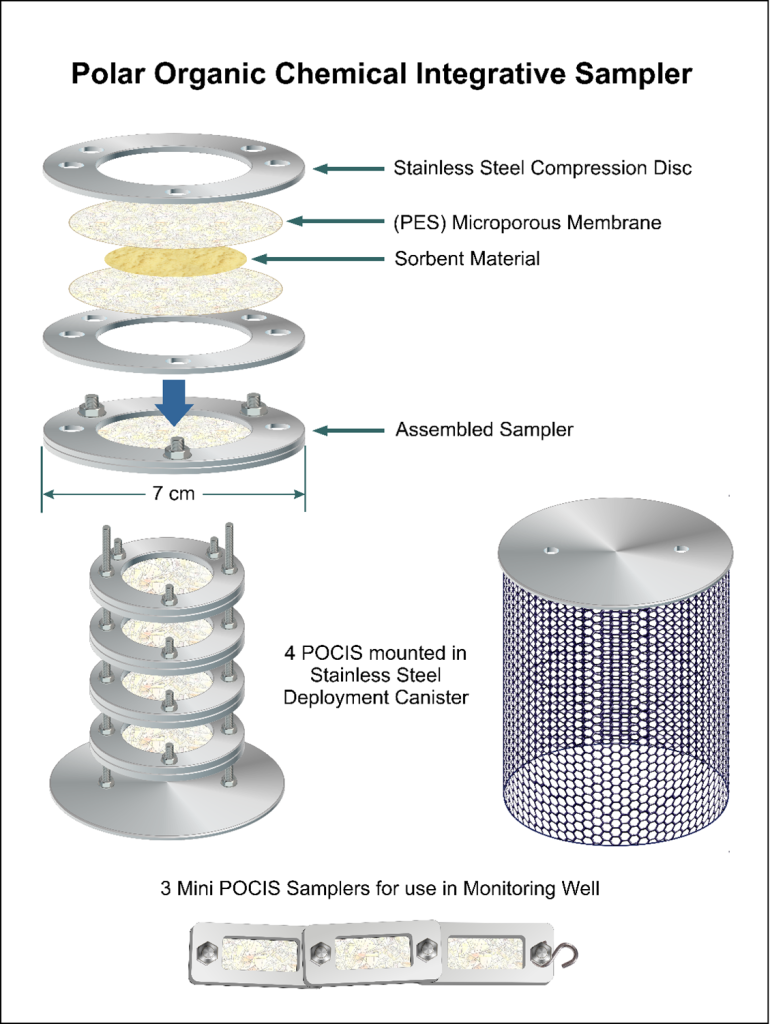
Figure 5-32. Polar Organic Chemical Integrative Sampler.
Source: NJDEP, used with permission.
5.3.2.2 Installation and Use
Deployment time for POCIS is typically one month but can range from weeks to months depending on the study design ( Alvarez and Huckins 2004 [VK9IPYIJ] Alvarez, David, and Jim Huckins. 2004. “Polar Organic Chemical Integrative Sampler (POCIS).” USGS, November. https://www.cerc.usgs.gov/pubs/center/pdfdocs/pocis.pdf. ). Deployment equipment can vary depending on the site and target media but generally will require deployment hardware (cable and clamps, floats, tie-down anchor) and tools for device assembly ( Alvarez 2010 [DE6V4FIB] Alvarez, David A. 2010. Guidelines for the Use of the Semipermeable Membrane Device (SPMD) and the Polar Organic Chemical Integrative Sampler (POCIS) in Environmental Monitoring Studies. U.S. Geological Survey. https://pubs.usgs.gov/tm/tm1d4/pdf/tm1d4.pdf. ). The device, secured at the desired location in the water column, must remain submerged for the entire deployment period, but not buried in the sediment, to achieve data representative of the target media ( Alvarez and Huckins 2004 [VK9IPYIJ] Alvarez, David, and Jim Huckins. 2004. “Polar Organic Chemical Integrative Sampler (POCIS).” USGS, November. https://www.cerc.usgs.gov/pubs/center/pdfdocs/pocis.pdf. ). If the device is exposed to air, there can be potential loss of chemicals with higher volatility from the POCIS and accumulation of chemicals from the air, resulting in measurements of nontarget media. Deployment methods can vary depending on the site and target media, but some common examples are tying the device to a fixed point on the shore (tree, boulder, fence post, etc.), hanging the device in open water (buoy, pier, floating platform), or suspending at the bottom with anchors and floats ( Alvarez 2010 [DE6V4FIB] Alvarez, David A. 2010. Guidelines for the Use of the Semipermeable Membrane Device (SPMD) and the Polar Organic Chemical Integrative Sampler (POCIS) in Environmental Monitoring Studies. U.S. Geological Survey. https://pubs.usgs.gov/tm/tm1d4/pdf/tm1d4.pdf. ). During the deployment period, considerations must be made for the effects of accumulation of suspended sediments or biofouling on the membrane surface over prolonged water exposure, protection from vandalism or external events, etc. ( Alvarez and Huckins 2004 [VK9IPYIJ] Alvarez, David, and Jim Huckins. 2004. “Polar Organic Chemical Integrative Sampler (POCIS).” USGS, November. https://www.cerc.usgs.gov/pubs/center/pdfdocs/pocis.pdf. ). After retrieval, the sorbent is transferred to a chromatography column for sample recovery. Using an organic solvent optimized for the specific sorbent and target chemicals, the sampled chemicals are recovered.
POCIS extracts have been analyzed by various instrumental techniques, including high performance liquid chromatography (HPLC), gas chromatography (GC), GC/ (mass spectrometry (MS), and liquid chromatograph/mass spectrometer (LC/MS) ( Alvarez and Huckins 2004 [VK9IPYIJ] Alvarez, David, and Jim Huckins. 2004. “Polar Organic Chemical Integrative Sampler (POCIS).” USGS, November. https://www.cerc.usgs.gov/pubs/center/pdfdocs/pocis.pdf. ). Additionally, bioindicator tests, such as Microtox and the Yeast Estrogen Screen, have been tested to determine the toxicological significance of the complex mixture of chemicals sampled by POCIS. POCIS can sample moderately polar to polar organic chemicals from water under almost any environmental conditions. The samplers have been successfully used in fresh, estuarine, and marine waters ( Alvarez and Huckins 2004 [VK9IPYIJ] Alvarez, David, and Jim Huckins. 2004. “Polar Organic Chemical Integrative Sampler (POCIS).” USGS, November. https://www.cerc.usgs.gov/pubs/center/pdfdocs/pocis.pdf. ).
5.3.2.3 Advantages
- POCIS are easily deployable to a variety of water bodies.
- POCIS can be used to sample hydrophilic organic compounds.
5.3.2.4 Limitations
- Samplers must remain submerged during deployment.
- Estimation of time-weighted average water concentrations from POCIS measurements requires the availability of experimentally derived sampling rates that may not be available for all chemicals of interest.
5.3.3 Sentinel PFAS Passive Sampler
5.3.3.1 Description and Application
The Sentinel passive sampler is a time-integrative passive sampler specifically designed to measure PFAS in various environmental waters, including groundwater, surface water, and pore water at concentrations ranging from low nanograms per liter (ng/L) to high micrograms per liter (µg/L). It was developed with U.S. Department of Defense funding under Strategic Environmental Research and Development Project ER20-1127.
The Sentinel passive sampler body (Figure 5-33) is a thin tag-like shape (approximately 2.5 cm wide by 5.0 cm long) constructed of either HDPE for water sampling or stainless steel for sediment pore water sampling, with a 1-cm diameter through-hole to contain sorbent resin. The sorbent resin consists of a modified organosilica (Osorb) infused with cross-linked polyethyleneimine and copper ions to optimize PFAS sorption across a range of chain lengths ( Edmiston et al. 2023 [WFMXVRAJ] Edmiston, Paul L., Erika Carter, Kevin Toth, et al. 2023. “Field Evaluation of the SentinelTM Integrative Passive Sampler for the Measurement of Perfluoroalkyl and Polyfluoroalkyl Substances in Water Using a Modified Organosilica Adsorbent.” Groundwater Monitoring & Remediation 43 (4): 38–54. https://doi.org/10.1111/gwmr.12574. ). The resin is emplaced between HDPE mesh screens and is in direct contact with the environmental water being sampled. The sorbent comes prewetted with glycerol from the manufacturer, which allows the samplers to be placed directly into the environmental water without pretreatment steps ( [77UF7LCY] Aquanex Technologies, LLC. n.d. “FAQ: SentinelTM PFAS Passive Samplers.” Accessed February 12, 2024. https://aquanextech.com/pages/faq-sentinel%e2%84%a2-passive-sampler. ). The sampler has two attachment points (at either end), with one end sized and tapered to fit into a standard 50 mL centrifuge tube, which reduces handling during sample collection, transport, and analysis. A small stainless steel weight is included with the sampler.
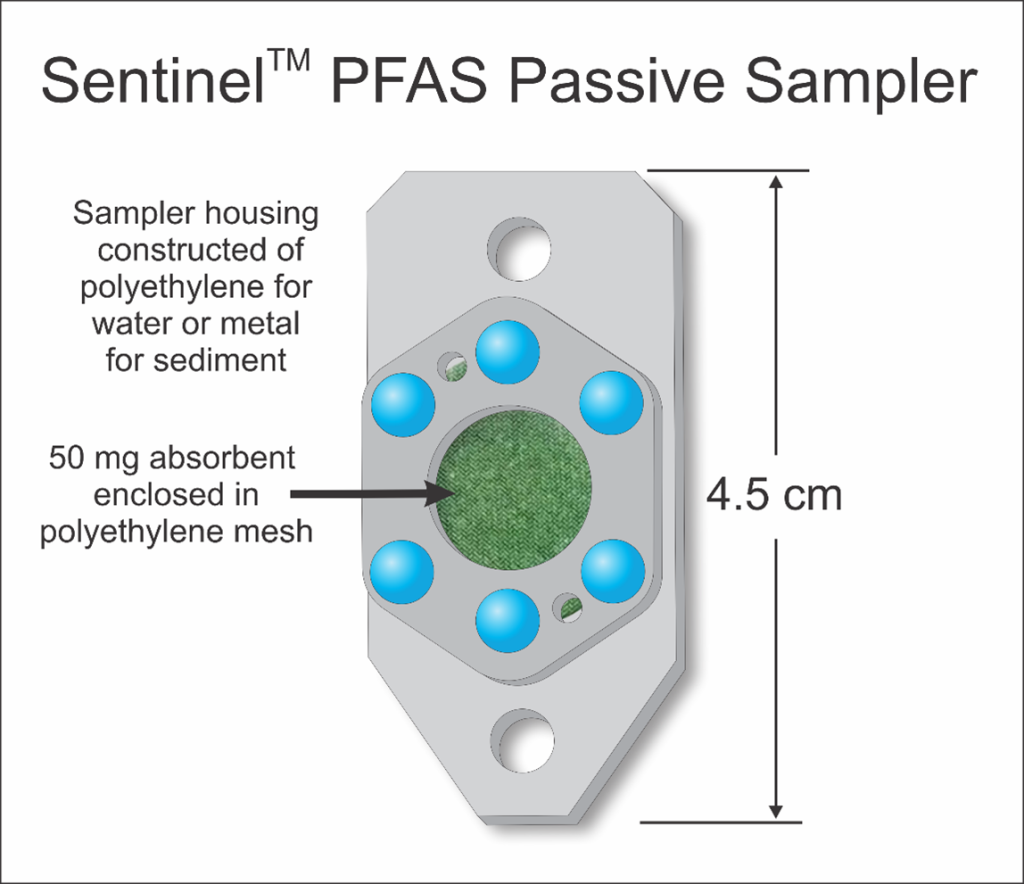
Figure 5-33. Sentinel PFAS sampler.
Source: NJDEP, figure used with permission.
During the deployment period, PFAS compounds accumulate on/in the sorbent. Following retrieval, PFAS compounds are extracted from the sampler in the laboratory, and the compound mass accumulated on the passive sampler is measured and converted to the average concentration in the water during the period of deployment. The samplers may be analyzed using modified versions of standard PFAS methods, including USEPA Method 537.1 or USEPA Method 1633.
The accumulated mass (ng) recovered from the Sentinel passive sampler is converted to the aqueous phase concentration, Cw (ng/L), using Equation 5 ( Edmiston et al. 2023 [WFMXVRAJ] Edmiston, Paul L., Erika Carter, Kevin Toth, et al. 2023. “Field Evaluation of the SentinelTM Integrative Passive Sampler for the Measurement of Perfluoroalkyl and Polyfluoroalkyl Substances in Water Using a Modified Organosilica Adsorbent.” Groundwater Monitoring & Remediation 43 (4): 38–54. https://doi.org/10.1111/gwmr.12574. ):
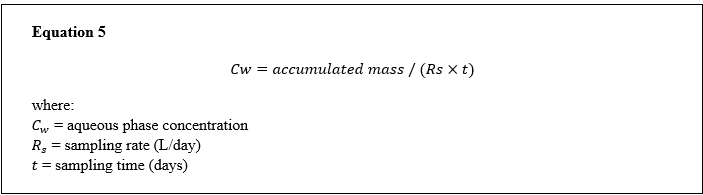
Sampling rates (Rs) are experimentally determined in bench-scale measurements for each PFAS analyte and vary according to flow rate and temperature. Recorded field temperature and flow rate category (groundwater versus surface water) are incorporated in the laboratory calculation of the PFAS concentration in the water. Rs values have been determined for all 40 of the compounds included in USEPA Method 1633. As of the publication date of this report, several commercial laboratories offer analysis of the Sentinel passive sampler.
Experiments have shown that passive sampler uptake rates are relatively constant, even under a range of temperature, pH, ionic strength, and natural organic matter concentrations, which suggests potential applicability to a wide range of environmental water types ( Hartmann et al. 2021 [Y5HC6KRL] Hartmann, Heather, Claire Hefner, Erika Carter, David Liles, Craig Divine, and Paul L. Edmiston. 2021. “Passive Sampler Designed for Per- and Polyfluoroalkyl Substances Using Polymer-Modified Organosilica Adsorbent.” AWWA Water Science 3 (4): e1237. https://doi.org/10.1002/aws2.1237. ). A user may conduct site-specific calibration of Rs if needed to improve comparability between passive and conventional sampling results based on observed field conditions. The Sentinel passive sampler was demonstrated in the field at deployment durations of several days to several weeks ( Edmiston et al. 2023 [WFMXVRAJ] Edmiston, Paul L., Erika Carter, Kevin Toth, et al. 2023. “Field Evaluation of the SentinelTM Integrative Passive Sampler for the Measurement of Perfluoroalkyl and Polyfluoroalkyl Substances in Water Using a Modified Organosilica Adsorbent.” Groundwater Monitoring & Remediation 43 (4): 38–54. https://doi.org/10.1111/gwmr.12574. ). Laboratory studies found that deployment duration should generally be limited to a maximum of 45 days due to the potential for short-chain PFAS to approach equilibrium at longer deployment times ( Edmiston et al. 2023 [WFMXVRAJ] Edmiston, Paul L., Erika Carter, Kevin Toth, et al. 2023. “Field Evaluation of the SentinelTM Integrative Passive Sampler for the Measurement of Perfluoroalkyl and Polyfluoroalkyl Substances in Water Using a Modified Organosilica Adsorbent.” Groundwater Monitoring & Remediation 43 (4): 38–54. https://doi.org/10.1111/gwmr.12574. ).
5.3.3.2 Installation and Use
The small size of the Sentinel passive sampler permits a variety of attachment configurations. Most importantly, the Sentinel passive sampler needs to remain submerged within the water column being sampled during the duration of deployment and should not rest within sediment (except for sediment pore water applications). Guidance for groundwater and surface water field applications is available from the SERDP project website ( Divine et al. 2023 [JCP2UFFR] Divine, Craig, Shandra Justicia-León, Jennifer M. Tilton, et al. 2023. “Field Methods and Example Applications for the Min-Trap® Mineral Sampler.” Remediation Journal 33 (3): 209–16. https://doi.org/10.1002/rem.21752. ; Divine and Edmiston 2022 [BAK8T9JS] Divine, Craig, and Paul Edmiston. 2022. Technology Guidance for SentinelTM Passive PFAS Samplers: Osorb® Media Use in PFAS Passive Samplers. SERDP Technical Guidance Nos. ER20-1127. SERDP. https://serdp-estcp-storage.s3.us-gov-west-1.amazonaws.com/s3fs-public/2023-12/ER20-1127%20Technical%20Guidance.pdf?VersionId=34bFzHz68_uzd_vzGAFtnyxHHH5sZoRx. ). For groundwater applications, the passive sampler may be attached to a deployment line (for example, nylon or polypropylene) using cable ties or wire, weighted using the included stainless steel weight, and suspended from the well cap. If additional weight is needed (to overcome buoyancy of deployment line), it should be attached directly to the deployment line. For surface water applications, the passive sampler attachment point (for example, driven stake, concrete block) should be submerged below the water surface and in a zone of flowing water (if surface water is flowing). Specific guidelines for sediment applications have not been published to date but are the subject of current research ( [G8CXRWVC] SERDP/ESTCP. n.d. “Osorb Passive Sampler for Determination of PFAS in Sediment Porewater.” Accessed May 3, 2024. https://serdp-estcp.mil/projects/details/e35f142d-31d4-468d-bfe0-619a83e9abfc. ; Lotufo et al. 2022 [BM8MW6FA] Lotufo, Guilherme R., Mandy M. Michalsen, Danny D. Reible, et al. 2022. “Interlaboratory Study of Polyethylene and Polydimethylsiloxane Polymeric Samplers for Ex Situ Measurement of Freely Dissolved Hydrophobic Organic Compounds in Sediment Porewater.” Environmental Toxicology and Chemistry 41 (8): 1885–902. https://doi.org/10.1002/etc.5356. )
The passive sampler is shipped inside a 50 mL centrifuge tube. This tube should be retained in a clean sealable bag for shipping the sampler to the laboratory following retrieval. At retrieval, the sampler should be detached from its attachment point. If passive sampler housing/weight contains gross sediment, shake manually, and gently rinse with PFAS-free DI water. Return the passive sampler (and weight) to the laboratory in the clean, labeled centrifuge tube. Samplers should be packed on ice for shipment to the laboratory. The field team must record the date/time of deployment, date/time of retrieval, water temperature, and flow category (groundwater, surface water, sediment) on the chain of custody form to permit calculation of PFAS concentrations.
5.3.3.3 Advantages
- The Sentinel passive sampler is small, easy to use, and commercially available.
- The single-use device limits potential for cross contamination.
- The time-integrative sampler provides average concentration over the entire period of deployment, capturing both spikes and low concentrations.
- The Sentinel passive sampler has a broad operating range over ng/L to µg/L in PFAS concentrations. Low detection limits can be achieved by accumulating PFAS on the sampler over days to weeks.
- Method minimizes sample handling, investigation-derived waste generation, and shipping costs.
5.3.3.4 Limitations
- The Sentinel passive sampler is new to the market in 2023 and therefore not yet in widespread use; several commercial laboratories perform analysis.
- Estimation of time-weighted average water concentrations from Sentinel passive sampler measurements require the availability of experimentally derived sampling rates that may not be available for all PFAS chemicals of interest. (To date, sampling rates are available for 40 PFAS listed in USEPA Method 1633.)
- Samplers must remain submerged during deployment.
5.3.4 Semipermeable Membrane Devices (SPMDs)
5.3.4.1 Description and Applications
Semipermeable membrane devices (SPMDs) (Figure 5-34) were developed in the mid-1990s by personnel at the USGS Columbia Environmental Research Center and designed to sample HOCs in surface water, mimicking the accumulation of HOCs and pesticides into the fatty tissues of organisms ( Huckins et al. 2006 [6V87RUVQ] Huckins, James N., Jimmie D. Petty, and Kees Booji. 2006. Monitors of Organic Chemicals in the Environment Semipermeable Membrane Devices. Springer eBooks. https://doi.org/10.1007/0-387-35414-x. ). Although SPMDs have been used for sampling both water and air, they are primarily used in surface water monitoring. SPMDs have also been adapted to sample HOCs in groundwater in wells ( Alvarez 2010 [DE6V4FIB] Alvarez, David A. 2010. Guidelines for the Use of the Semipermeable Membrane Device (SPMD) and the Polar Organic Chemical Integrative Sampler (POCIS) in Environmental Monitoring Studies. U.S. Geological Survey. https://pubs.usgs.gov/tm/tm1d4/pdf/tm1d4.pdf. ). SPMDs have been used to determine freely dissolved (bioavailable) concentrations of HOCs with log octanol-water partition coefficients (log KOW) greater than 3, such as PAHs and PCBs. Extracts from SPMDs can also be screened by in vitro and in vivo bioindicator tests to determine the potential effects on biota from exposure to the complex mixtures of chemicals present at a site ( Imbrigiotta and Harte 2020 [9LSVPE48] Imbrigiotta, Thomas, and Philip Harte. 2020. “Passive Sampling of Groundwater Wells for Determination of Water Chemistry.” In U.S. Geological Survey Techniques and Methods. https://doi.org/10.3133/tm1d8. ).
The SPMD is an integrative sampler that accumulates chemical mass over a deployment period that typically ranges from days to months. The SPMD consists of a high-purity lipid such as triolein, which serves as a representation of the fatty tissues of aquatic organisms, and a thin-walled (50–100 μm) nonporous lay-flat polyethylene membrane tube (Figures 5-34 and 5-35). The tube allows the nonpolar chemicals to pass through to the lipid where the chemicals are concentrated. The tube excludes larger molecules (> 600 Daltons) and materials such as particulate matter and microorganisms.
SPMDs use the PRC approach to account for site-specific environmental factors that can affect the sampling rates such as water flow, temperature, and the buildup of a biofilm on the sampler’s surface ( Tertuliani et al. 2008 [VIWQ5933] Tertuliani, J. S., D. A. Alvarez, E. T. Furlong, M. T. Meyer, S. D. Zaugg, and G. F. Koltun. 2008. Occurrence of Organic Wastewater Compounds in the Tinkers Creek Watershed and Two Other Tributaries to the Cuyahoga River, Northeast Ohio. Scientific Investigations Report Nos. 2008–5173. U.S. Geological Survey. https://pubs.usgs.gov/sir/2008/5173/pdf/sir20085173.pdf. ). The calculated amount of PRC lost during deployment (Figure 5-37) is used to adjust the laboratory sampling rates at each sampling location.
Chemicals sampled by SPMDs include HOCs (with log KOW) greater than 3, such as PCBs, PAHs, organochlorine pesticides, dioxins and furans, selected organophosphate and pyrethroid pesticides, and many other nonpolar organic chemicals.
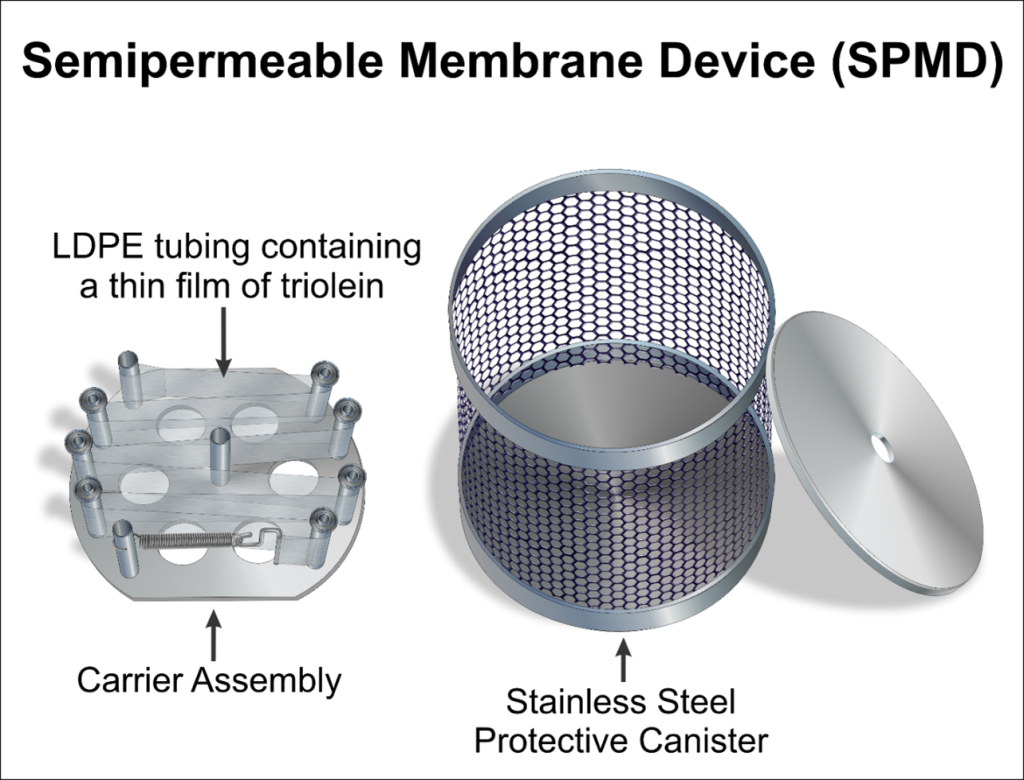
Figure 5-34. Semipermeable membrane device (SPMD) sampler.
Source: NJDEP, used with permission.
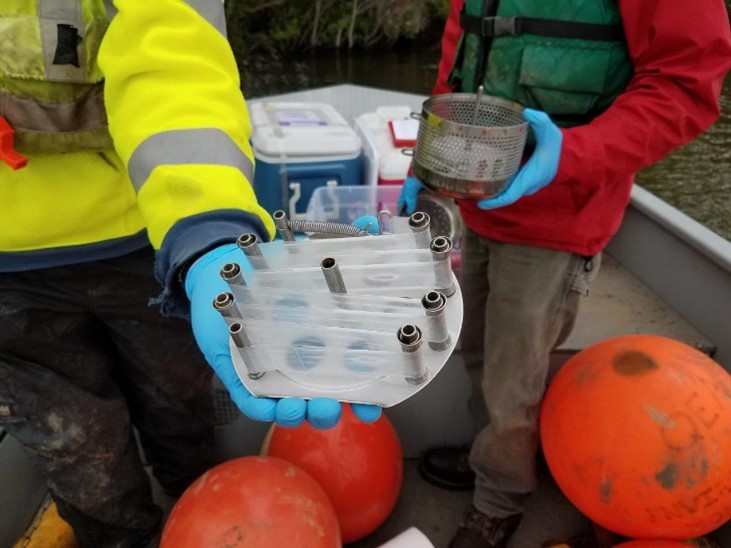
Figure 5-35. SPMD carrier assembly and triolein film.
Source: Anchor QEA, used with permission.
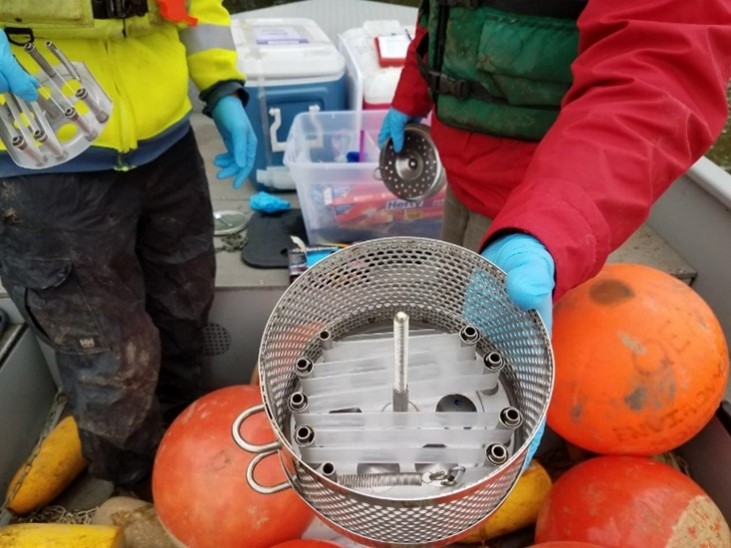
Figure 5-36. SPMD carrier assembly inside the protective canister.
Source: Anchor QEA, used with permission.
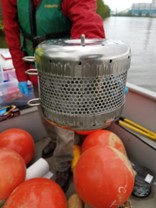
Figure 5-37. A semipermeable membrane device assembled prior to deployment.
Source: Anchor QEA, used with permission.
5.3.4.2 Installation and Use
SPMDs come from the commercial vendor as intact samplers, with the triolein film sealed in the PE tube and the requested PRCs added, and are dependent on the needs of the user (Figure 5-37). For example, the SPMDs may be preloaded onto carrier racks and shipped in cleaned airtight metal cans, ready to be loaded into protective deployment canisters in the field (Figure 5-36). Or if the user has deployment hardware, the SPMDs may be shipped loose in small cleaned airtight metal cans ready to attach to the deployment apparatus in the field. Two sizes of deployment canisters are commercially available (capable of holding between 2 and 5 SPMDs), but custom ones can be created and used provided they meet specific criteria (Figure 5-37) ( Alvarez 2010 [DE6V4FIB] Alvarez, David A. 2010. Guidelines for the Use of the Semipermeable Membrane Device (SPMD) and the Polar Organic Chemical Integrative Sampler (POCIS) in Environmental Monitoring Studies. U.S. Geological Survey. https://pubs.usgs.gov/tm/tm1d4/pdf/tm1d4.pdf. ).
Deployment equipment can vary depending on the site and target media but generally will require deployment hardware (cable and clamps, floats, tie-down anchor) and tools for device assembly ( Alvarez 2010 [DE6V4FIB] Alvarez, David A. 2010. Guidelines for the Use of the Semipermeable Membrane Device (SPMD) and the Polar Organic Chemical Integrative Sampler (POCIS) in Environmental Monitoring Studies. U.S. Geological Survey. https://pubs.usgs.gov/tm/tm1d4/pdf/tm1d4.pdf. ). The device, secured at the desired location in the water column, must remain submerged for the entire deployment period, but not buried in the sediment, to achieve data representative of the target media. If the device is exposed to air, there can be a potential loss of chemicals with higher volatility from the SPMD and accumulation of chemicals from the air, resulting in measurements of nontarget media. It is important to keep SPMDs shaded to prevent the photodegradation of some light-sensitive chemicals such as PAHs. Deployment methods can vary depending on the site and target media, but some common examples are tying the device to a fixed point on the shore (tree, boulder, fence post, etc.), hanging the device in open water (buoy, pier, floating platform), or suspending at the bottom with anchors and floats ( Alvarez 2010 [DE6V4FIB] Alvarez, David A. 2010. Guidelines for the Use of the Semipermeable Membrane Device (SPMD) and the Polar Organic Chemical Integrative Sampler (POCIS) in Environmental Monitoring Studies. U.S. Geological Survey. https://pubs.usgs.gov/tm/tm1d4/pdf/tm1d4.pdf. ). During the deployment period, considerations must be made for the effects of biofouling over prolonged water exposure, protection from vandalism or external events, etc.
Once the deployment period has been achieved, the device is removed from the water, SPMDs are placed in air-tight shipping containers and returned to the laboratory on ice. To conduct SPMD dialysis, remove each device from the storage container/support rack and clean to remove surficial particulate matter and biofilm ( Alvarez et al. 2008 [DIQJYMEN] Alvarez, David A., Walter L. Cranor, Stephanie D. Perkins, Randal C. Clark, and Steven B. Smith. 2008. “Chemical and Toxicologic Assessment of Organic Contaminants in Surface Water Using Passive Samplers.” Journal of Environmental Quality 37 (3): 1024–33. https://doi.org/10.2134/jeq2006.0463. ). Sampled chemicals are recovered from the SPMDs using a two-step dialysis method into hexane following a surficial cleaning to remove adhered particulate matter and biofilm. Dialysis times may vary depending on target chemicals. Extended dialysis periods (over three 24-hour periods) may result in an increased amount of coextracted matrix components in the sample ( Alvarez 2010 [DE6V4FIB] Alvarez, David A. 2010. Guidelines for the Use of the Semipermeable Membrane Device (SPMD) and the Polar Organic Chemical Integrative Sampler (POCIS) in Environmental Monitoring Studies. U.S. Geological Survey. https://pubs.usgs.gov/tm/tm1d4/pdf/tm1d4.pdf. ). Following dialysis, additional cleanup and fractionation of the samples is dependent on the target analytes but typically involves size exclusion chromatography and other sorbent-based chromatographic methods ( Alvarez et al. 2008 [DIQJYMEN] Alvarez, David A., Walter L. Cranor, Stephanie D. Perkins, Randal C. Clark, and Steven B. Smith. 2008. “Chemical and Toxicologic Assessment of Organic Contaminants in Surface Water Using Passive Samplers.” Journal of Environmental Quality 37 (3): 1024–33. https://doi.org/10.2134/jeq2006.0463. ; Alvarez 2010 [DE6V4FIB] Alvarez, David A. 2010. Guidelines for the Use of the Semipermeable Membrane Device (SPMD) and the Polar Organic Chemical Integrative Sampler (POCIS) in Environmental Monitoring Studies. U.S. Geological Survey. https://pubs.usgs.gov/tm/tm1d4/pdf/tm1d4.pdf. ).
5.3.4.3 Advantages
- SPMDs provide data as a time-weighted average concentration of a chemical within the whole deployment period ( Alvarez 2010 [DE6V4FIB] Alvarez, David A. 2010. Guidelines for the Use of the Semipermeable Membrane Device (SPMD) and the Polar Organic Chemical Integrative Sampler (POCIS) in Environmental Monitoring Studies. U.S. Geological Survey. https://pubs.usgs.gov/tm/tm1d4/pdf/tm1d4.pdf. ).
- Low detection limits can be achieved for HOCs because SPMDs can concentrate HOCs during the period of deployment.
- The concentrations of HOCs measured by SPMDs represent freely dissolved (bioavailable) concentrations.
5.3.4.4 Limitations
- Surface water sampling for HOCs can be done by other commonly used passive samplers such as LDPE samplers, which are readily available. In contrast, the sole commercial vendor of SPMDs in North America is Environmental Sampling Technologies, Inc. (St. Joseph, Missouri). They can also provide standard operating procedures for completing the extractions of SPMD matrix for laboratory processing and analysis.
- Long deployments can result in a substantial buildup of a biofilm, which can inhibit the ability of the sampler to accumulate chemicals. The use of PRC can improve quantitation of the target chemicals.
- Short deployments will yield smaller volumes of sampled water, which limits some of the advantages of using a passive sampler ( Alvarez 2010 [DE6V4FIB] Alvarez, David A. 2010. Guidelines for the Use of the Semipermeable Membrane Device (SPMD) and the Polar Organic Chemical Integrative Sampler (POCIS) in Environmental Monitoring Studies. U.S. Geological Survey. https://pubs.usgs.gov/tm/tm1d4/pdf/tm1d4.pdf. ).
5.3.5 Diffusive Gradient in Thin Films (DGT)
5.3.5.1 Description and Application
Diffusive gradient in thin films (DGT) (Figure 5-38) has been used to sample dissolved inorganic and organic chemicals in aqueous environments, including pore water, surface water, and groundwater ( Zhang and Davison 2015 [862YQQBI] Zhang, Hao, and William Davison. 2015. “Use of Diffusive Gradients in Thin-Films for Studies of Chemical Speciation and Bioavailability.” Environmental Chemistry 12 (January). https://doi.org/10.1071/EN14105. ). Since the first development by researchers at Lancaster University in 1994 ( Davison and Zhang 1994 [5W5RXFN4] Davison, W., and H. Zhang. 1994. “In Situ Speciation Measurements of Trace Components in Natural Waters Using Thin-Film Gels.” Nature 367 (6463): 546–48. https://doi.org/10.1038/367546a0. ), the DGT technique has been predominantly used to measure inorganic chemicals in aqueous media. In the last few decades, the DGT technique has been improved and expanded to measure a large number of inorganic chemicals, including heavy metals, inorganic nutrients, oxyanions, and radionuclides ( Marrugo-Madrid et al. 2021 [UG6L9JW9] Marrugo-Madrid, Siday, Marta Turull, Hao Zhang, and Sergi Díez. 2021. “Diffusive Gradients in Thin Films for the Measurement of Labile Metal Species in Water and Soils: A Review | Environmental Chemistry Letters.” Environmental Chemistry Letters 19: 3761–88. https://link.springer.com/article/10.1007/s10311-021-01246-3. ). In addition, DGT has recently been modified and adapted to sample a variety of organic compounds, such as pharmaceuticals ( Challis et al. 2016 [K23QPDVR] Challis, Jonathan K., Mark L. Hanson, and Charles S. Wong. 2016. “Development and Calibration of an Organic-Diffusive Gradients in Thin Films Aquatic Passive Sampler for a Diverse Suite of Polar Organic Contaminants.” Analytical Chemistry 88 (21): 10583–91. https://doi.org/10.1021/acs.analchem.6b02749. ; Fang et al. 2019 [NBPJGSH8] Fang, Zhou, Li Kexin, Yuan Li, et al. 2019. “Development and Application of the Diffusive Gradients in Thin-Films Technique for Measuring Psychiatric Pharmaceuticals in Natural Waters - PubMed.” Environ Sci Technol 53 (19): 11223–31. https://doi.org/10.1021/acs.est.9b03166. ), antibiotics ( Cheng et al. 2013 [SKMG77W6] Cheng, Hairong, Zongming Deng, Paromita Chakraborty, et al. 2013. “A Comparison Study of Atmospheric Polycyclic Aromatic Hydrocarbons in Three Indian Cities Using PUF Disk Passive Air Samplers.” Atmospheric Environment 73 (July): 16–21. https://doi.org/10.1016/j.atmosenv.2013.03.001. ; Xie et al. 2018 [97PQFZYR] Xie, Huaijun, Jingwen Chen, Qining Chen, et al. 2018. “Development and Evaluation of Diffusive Gradients in Thin Films Technique for Measuring Antibiotics in Seawater.” The Science of the Total Environment 618 (March): 1605–12. https://doi.org/10.1016/j.scitotenv.2017.09.330. ), and PFAS ( Wang et al. 2021 [P9JILGTP] Wang, Po, Jonathan K. Challis, Kim H. Luong, Trisha C. Vera, and Charles S. Wong. 2021. “Calibration of Organic-Diffusive Gradients in Thin Films (o-DGT) Passive Samplers for Perfluorinated Alkyl Acids in Water.” Chemosphere 263 (January): 128325. https://doi.org/10.1016/j.chemosphere.2020.128325. ; Fang et al. 2021 [Q6Q5GZQY] Fang, Zhou, Yuan Li, Yanying Li, et al. 2021. “Development and Applications of Novel DGT Passive Samplers for Measuring 12 Per- and Polyfluoroalkyl Substances in Natural Waters and Wastewaters.” Environmental Science & Technology 55 (14): 9548–56. https://doi.org/10.1021/acs.est.0c08092. ), although future studies may be needed to fill several gaps and limitations to apply DGT for organic chemicals ( Ji et al. 2022 [LS64NE8X] Ji, Xiaowen, Jonathan K. Challis, and Markus Brinkmann. 2022. “A Critical Review of Diffusive Gradients in Thin Films Technique for Measuring Organic Pollutants: Potential Limitations, Application to Solid Phases, and Combination with Bioassays.” Chemosphere 287 (January): 132352. https://doi.org/10.1016/j.chemosphere.2021.132352. ).
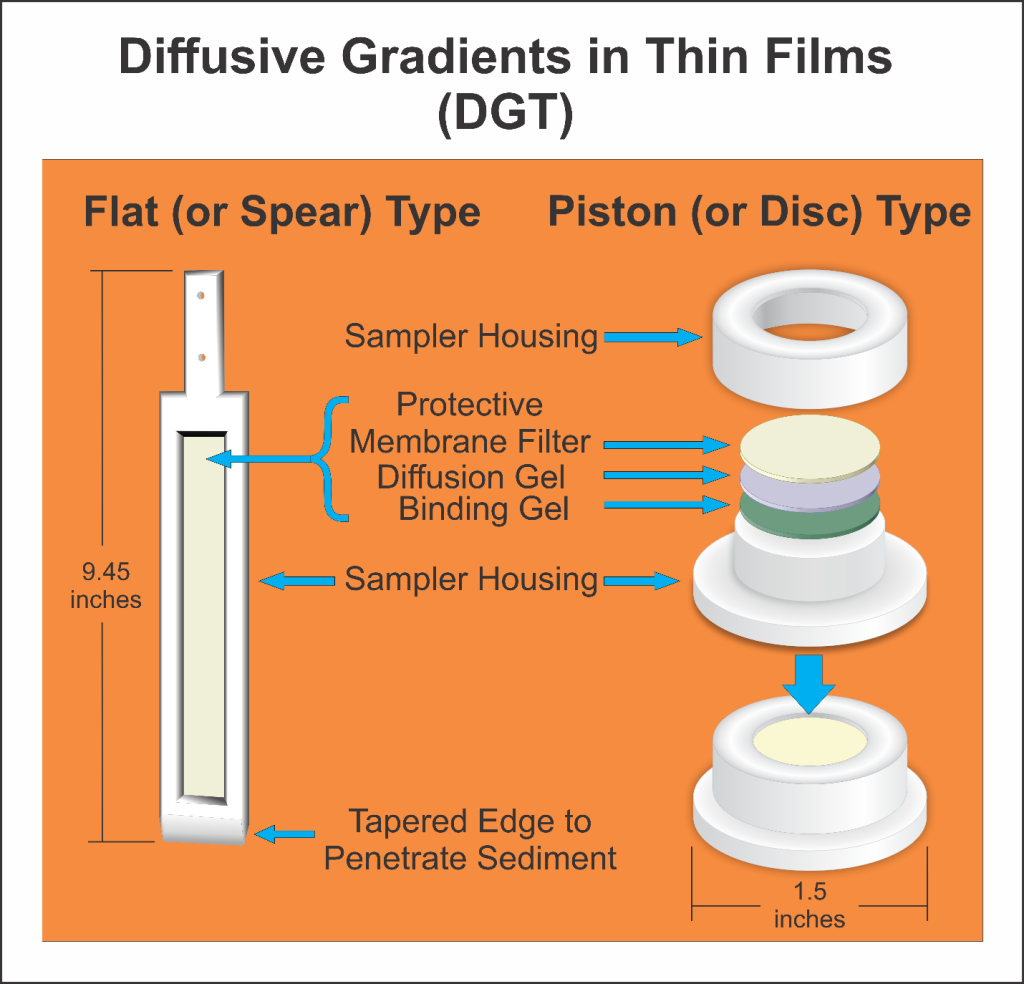
Figure 5-38. Diffusive gradient in thin films (DGT) sampler.
Source: NJDEP, figure used with permission.
DGT usually comprises three successive layers of material held together by a plastic housing. The outer protective layer is typically a filter membrane with 0.45 µm pore size that permits only dissolved species to interact with the underlying gels, protects the gels from physical damages, and prevents the influence of surrounding hydrodynamic fluctuations. Below the protective membrane filter is a diffusion hydrogel with a known thickness. Dissolved chemicals diffuse through the diffusion hydrogel layer, and the diffusion kinetics in the diffusion hydrogel are well known and established for many chemicals. Below the diffusion gel is a binding gel that reacts with dissolved species diffused through the diffusion gel and serves as a chemical sink. Because DGT is an accumulation-type sampler, it works at the linear accumulation regime (or kinetic regime), where the chemical uptake is linearly correlated with time ( Wang et al. 2021 [P9JILGTP] Wang, Po, Jonathan K. Challis, Kim H. Luong, Trisha C. Vera, and Charles S. Wong. 2021. “Calibration of Organic-Diffusive Gradients in Thin Films (o-DGT) Passive Samplers for Perfluorinated Alkyl Acids in Water.” Chemosphere 263 (January): 128325. https://doi.org/10.1016/j.chemosphere.2020.128325. ). Because the binding gel accumulates a target chemical over time, DGT can achieve better detection limits after longer deployment times. However, once the binding gel is saturated with a target chemical, the DGT sampler is no longer useful to quantitatively determine its dissolved concentration.
Because the diffusion kinetics in the diffusion hydrogel are well established for many chemicals, a concentration of a target chemical at the surface of DGT can be calculated from the mass of the chemical accumulated to the binding gel ( Zhang and Davison 2015 [862YQQBI] Zhang, Hao, and William Davison. 2015. “Use of Diffusive Gradients in Thin-Films for Studies of Chemical Speciation and Bioavailability.” Environmental Chemistry 12 (January). https://doi.org/10.1071/EN14105. ). Both the membrane filter and the hydrogel effectively exclude target chemicals associated with larger molecules such as aqueous complexes, colloids, and humic substances. Therefore, DGT is a suitable technique for in situ evaluation of labile fractions and, by approximation, bioavailability of a target chemical in aqueous media, although some chemicals associated with dissolved organic matters can be sampled by DGT ( Davison and Zhang 1994 [5W5RXFN4] Davison, W., and H. Zhang. 1994. “In Situ Speciation Measurements of Trace Components in Natural Waters Using Thin-Film Gels.” Nature 367 (6463): 546–48. https://doi.org/10.1038/367546a0. ; Zhang 2004 [WM9DK8U4] Zhang, Hao. 2004. “In-Situ Speciation of Ni and Zn in Freshwaters: Comparison between DGT Measurements and Speciation Models | Environmental Science & Technology.” Environ. Sci. Technol 38 (5): 1421–27. https://doi.org/10.1021/es034654u. ; Warnken et al. 2008 [K99QIG4Y] Warnken, Kent W., William Davison, and Hao Zhang. 2008. “Interpretation of in Situ Speciation Measurements of Inorganic and Organically Complexed Trace Metals in Freshwater by DGT.” Environmental Science & Technology 42 (18): 6903–9. https://doi.org/10.1021/es800359n. ).
5.3.5.2 Installation and Use
The piston-type (or disk-type) and flat-type (also known as “spear-type”) samplers shown in Figure 5-38 are two common configurations for DGT. Selection of the DGT configuration depends on sampling media and objectives. The flat-type DGT can be deployed into sediments or soils to measure vertical concentration profiles of target chemicals in pore water ( Teasdale et al. 1999 [X8FZJWMF] Teasdale, P. R., S. Hayward, and W. Davison. 1999. “In Situ, High-Resolution Measurement of Dissolved Sulfide Using Diffusive Gradients in Thin Films with Computer-Imaging Densitometry - PubMed.” Anal Chem 71 (11): 2186–96. https://doi.org/10.1021/ac981329u. ; Wei et al. 2022 [Y6NFRJZG] Wei, Tian-Jiao, Dong-Xing Guan, Xi-Yuan Li, et al. 2022. “Analysis of Studies on Environmental Measurements Using Diffusive Gradients in Thin-Films (DGT) from 1994 to 2020.” Journal of Soils and Sediments 22 (April). https://doi.org/10.1007/s11368-022-03168-1. ). When the flat-type DGT is deployed and positioned in surface sediment, the DGT can measure dissolved concentrations in both pore water and overlying surface water at the same time. Carefully insert the flat-type DGT by hand into sediment or soil so as not to alter physical characteristics of sediment or soil such as density, which may result in biased results ( Li et al. 2019 [QNRWN4I7] Li, Cai, Shiming Ding, Liyuan Yang, et al. 2019. “Diffusive Gradients in Thin Films: Devices, Materials and Applications.” Environmental Chemistry Letters 17 (2): 801–31. https://doi.org/10.1007/s10311-018-00839-9. , Li et al. 2012 [X9GF3GG2] Li, Yingming, Dawei Geng, Fubin Liu, et al. 2012. “Study of PCBs and PBDEs in King George Island, Antarctica, Using PUF Passive Air Sampling.” Atmospheric Environment 51 (May): 140–45. https://doi.org/10.1016/j.atmosenv.2012.01.034. ). The piston-type DGT can be used to measure dissolved concentrations of target chemicals in aqueous media or placed on the sediment surface to measure chemical flux at the sediment–surface water interface.
It should be noted that DGT needs to be deoxygenated prior to use because dissolved oxygen in the diffusion hydrogel and binding gel can influence the speciation of redox-sensitive chemicals. For example, dissolved sulfide measurement in sediment pore water by the DGT technique has been shown to be very effective ( Teasdale et al. 1999 [X8FZJWMF] Teasdale, P. R., S. Hayward, and W. Davison. 1999. “In Situ, High-Resolution Measurement of Dissolved Sulfide Using Diffusive Gradients in Thin Films with Computer-Imaging Densitometry - PubMed.” Anal Chem 71 (11): 2186–96. https://doi.org/10.1021/ac981329u. ), but dissolved sulfide is very sensitive to dissolved oxygen. DGT can be deoxygenated by submerging in 0.03 molar NaCl solution (or other solutions with different solutes or ionic strengths) gently bubbled with nitrogen or argon gas for more than 24 hours. After deoxygenation, DGT should be carefully shipped in sealed oxygen-barrier bags on ice in a cooler to the field site. DGT should be deployed as soon as possible after taking out from oxygen-barrier bags to minimize the introduction of oxygen into DGT.
The DGT deployment time should be carefully determined considering a few different factors. It should be sufficiently long to accumulate target chemicals in the binding gel but short enough to avoid the saturation of the binding gel. As noted above, the DGT deployment should be conducted to maintain the linear accumulation regime (or the kinetic regime) to accurately measure dissolved concentrations of target chemicals. Although a deployment time of ~24 hours has been recommended for DGT ( Burgess et al. 2017 [97JRK4GH] Burgess, R. M., S. B. Kane Driscoll, A. Burton, et al. 2017. Laboratory, Field, and Analytical Procedures for Using Passive Sampling in the Evaluation of Contaminated Sediments: User’s Manual. User’s Manual EPA/600/R-16/357. USEPA and SERDP-ESTCP. https://semspub.epa.gov/work/HQ/100000146.pdf. ), it can vary depending on target chemicals and their concentrations in the sampling media. The DGT binding gel can be saturated when deployed for a prolonged duration, which does not allow use of the linear diffusion assumption. Once the DGT binding gel is saturated, it is no longer used for quantitative sample. It may be necessary to deploy a few replicates to find an optimum deployment time. A prolonged DGT deployment time in soil or sediment may also cause the depletion of target chemicals in pore water ( Ernstberger et al. 2005 [TMB74A7L] Ernstberger, H., H. Zhang, A. Tye, S. Young, and W. Davison. 2005. “Desorption Kinetics of Cd, Zn, and Ni Measured in Soils by DGT.” Environmental Science & Technology 39 (6): 1591–97. https://doi.org/10.1021/es048534d. ). Therefore, the uptake mass of the target chemical should be small enough not to alter the initial concentration of the target chemical.
The DGT deployment time, temperature, pH, and salinity in aqueous media need to be recorded during deployment and retrieval. The diffusion coefficients of target chemicals in the diffusion hydrogel vary depending on temperature. The water quality parameters may be necessary to calculate the distribution of aqueous species of inorganics.
DGT should be carefully deployed, positioned, and secured to measure dissolved concentrations of target chemicals in pore water. When the flat-type DGT is used, the depth of penetration should be recorded. DGT should be tied with a weight to submerge under the water surface when deployed in surface water or groundwater.
5.3.5.3 Advantages
- DGT can be purchased as assembled units from a manufacturer, or selected components can be purchased so that users can assemble custom-made units.
- Better detection limits can be achieved with a longer deployment time because the DGT binding gel accumulates target chemicals over time.
- DGT allows in situ evaluation of labile fractions of target chemicals, and by approximation, bioavailability in aqueous environments.
- A spear-type DGT can be inserted into the sediment or soil vertically to assess the vertical profile of a target chemical with submillimeter high resolution.
5.3.5.4 Limitations
- A longer deployment time may cause the saturation of the DGT binding gel and the depletion of target chemicals in pore water, which may result in biased results.
- The diffusion kinetics of a target chemical can be influenced by several factors, such as temperature, competing chemicals, and biofilm development after longer deployment.
- Although DGT can be used to sample many different organic chemicals, future studies may be needed to further refine the sampler to overcome some limitations, such as lag times introduced by the filter membranes and storage of DGT ( Ji et al. 2022 [LS64NE8X] Ji, Xiaowen, Jonathan K. Challis, and Markus Brinkmann. 2022. “A Critical Review of Diffusive Gradients in Thin Films Technique for Measuring Organic Pollutants: Potential Limitations, Application to Solid Phases, and Combination with Bioassays.” Chemosphere 287 (January): 132352. https://doi.org/10.1016/j.chemosphere.2021.132352. ).
- DGT should be deoxygenated to reduce introduction of oxygen into reducing environments.
5.3.6 Mineral Sampler (Min-Traps)
5.3.6.1 Description and Application
The Min-Trap (Figure 5-39) is a passive sampling device that is deployed within a conventional monitoring well and allowed to incubate to collect mineral samples for analysis. It consists of a nonreactive medium (for example, silica sand), a reactive medium (for example, iron oxide sand or site soil), or a combination of both, contained within a water-permeable mesh, which is housed within a 1.5-inch diameter, 18-inch-long 0.010 inch slotted polyvinyl chloride (PVC) casing. The standard Min-Trap has a nonreactive medium that provides a carrier substrate where target minerals can form passively ( Tilton and Gentile 2019 [THUZSIYL] Tilton, Jennifer Martin, and Margaret Gentile. 2019. “Strategic Approaches to Address the Unique Challenges of Groundwater Remediation at Coal Ash Facilities.” https://uknowledge.uky.edu/cgi/viewcontent.cgi?article=1526&context=woca. ). Alternatively, the Min-Trap can be configured with reactive media to provide a substrate for mineral transformation processes taking place under the natural or engineered geochemical conditions in the aquifer. Groundwater flow modeling results indicate that the hydraulics of the Min-Trap are approximately representative of flux through an equivalent width of the aquifer ( Ulrich et al. 2021 [66YF5YT4] Ulrich, Shannon, Jennifer Martin Tilton, Shandra Justicia‐Leon, et al. 2021. “Laboratory and Initial Field Testing of the Min‐TrapTM for Tracking Reactive Iron Sulfide Mineral Formation during in Situ Remediation.” Remediation Journal 31 (3): 35–48. https://doi.org/10.1002/rem.21681. ). The minerals accumulating in a Min-Trap are representative of minerals forming in the subsurface. Because Min-Traps are designed to measure minerals that are actively forming, they are not intended to assess background mineralogy of an aquifer. Min-Traps were demonstrated for use at chlorinated solvent sites in an ESTCP project (ER19-5190). The final report highlights an advantage of Min-Traps being that laboratory analysis (for example, chemical, microscopic, and spectroscopic) of Min-Trap samples provides direct evidence of mineral formation, dissolution, and/or transformation processes while avoiding challenges associated with traditional sampling methods (typically, drilling) ( Divine 2022 [84A4BIPA] Divine, Criag. 2022. Demonstration of Mineral Traps to Passively Evaluate and Monitor In-Situ Reactive Minerals for Chlorinated Solvent Treatment. Final Report Nos. ER19-5190. Department of Defense Environmental Security Technology Certification Program (ESTCP). https://serdp-estcp-storage.s3.us-gov-west-1.amazonaws.com/s3fs-public/2023-05/ER19-5190%20Final%20Report.pdf?VersionId=6J.vmN6_wLLM3jjoxV3xErmmY_9iYm3u. ).
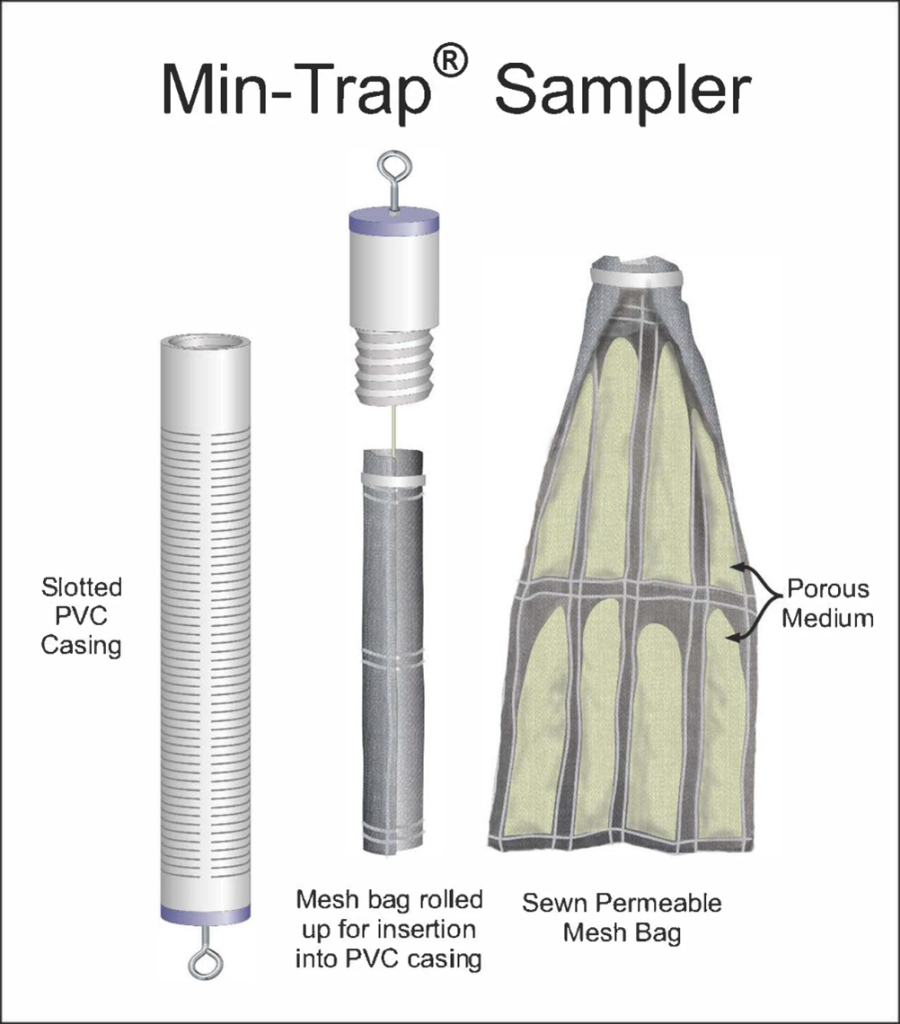
Figure 5-39. Min-Trap sampler.
Source: NJDEP, used with permission.
5.3.6.2 Installation and Use
Virtually any in situ remediation strategy that results in the precipitation, dissolution, or transformation of a mineral species can be validated, monitored, and assessed with Min-Traps. The Min-Trap approach is particularly applicable to identifying and quantifying the formation of reactive iron minerals for the treatment of CVOCs, which is often a target mechanism for in situ chemical reduction and enhanced reductive dichlorination strategies.
Min-Traps are attached to a suspension line and deployed within the target monitoring well screen zone (often at the center of the saturated interval). For wells with long screens, baffles at the top and bottom of the Min-Trap can be used to reduce the potential for in-well vertical mixing effects. Eyebolts at the top and bottom of the Min-Trap allow multiple samplers to be connected in series, if desired. It is recommended in Divine et al. ( Divine et al. 2023 [JCP2UFFR] Divine, Craig, Shandra Justicia-León, Jennifer M. Tilton, et al. 2023. “Field Methods and Example Applications for the Min-Trap® Mineral Sampler.” Remediation Journal 33 (3): 209–16. https://doi.org/10.1002/rem.21752. , Divine et al. 2023 [5M2FU9X8] Divine, Craig, Shandra Justicia-León, Jennifer Martin Tilton, et al. 2023. “Min-Trap® Samplers to Passively Monitor In-Situ Iron Sulfide Mineral Formation for Chlorinated Solvent Treatment.” Groundwater Monitoring & Remediation 43 (3): 57–69. https://doi.org/10.1111/gwmr.12595. ) that Min-Traps be deployed for at least 30 days to ensure recovery of detectable amounts of mineral mass; however, they can be deployed for longer periods depending on project objectives (zotpress items=”{4889498:JCP2UFFR}” style=”chicago-author-date”]; Divine et al. 2023 [5M2FU9X8] Divine, Craig, Shandra Justicia-León, Jennifer Martin Tilton, et al. 2023. “Min-Trap® Samplers to Passively Monitor In-Situ Iron Sulfide Mineral Formation for Chlorinated Solvent Treatment.” Groundwater Monitoring & Remediation 43 (3): 57–69. https://doi.org/10.1111/gwmr.12595. ).
At the conclusion of the deployment period, the Min-Trap is retrieved from the well, the housing is opened, and the media “pillows” are unrolled for logging and photo documentation. Care should be taken to process Min-Trap samples as quickly as possible (within minutes of removal from the well) to minimize exposure to the atmosphere. The media pillows may be separated with a cutting tool to provide the needed solid sample mass for desired laboratory analyses. Unused pillows can be placed back into the Min-Trap housing and redeployed for future sampling, if desired. The media pillow samples are double-sealed in a manner to minimize oxygen exposure (for example, vacuum sealing with a household vacuum sealer). The sealed samples are shipped on ice to the analytical laboratory. Further detailed descriptions of field deployment, sampling, and preservation procedures are presented in Divine et al. ( Divine et al. 2023 [JCP2UFFR] Divine, Craig, Shandra Justicia-León, Jennifer M. Tilton, et al. 2023. “Field Methods and Example Applications for the Min-Trap® Mineral Sampler.” Remediation Journal 33 (3): 209–16. https://doi.org/10.1002/rem.21752. ) ( Divine et al. 2023 [JCP2UFFR] Divine, Craig, Shandra Justicia-León, Jennifer M. Tilton, et al. 2023. “Field Methods and Example Applications for the Min-Trap® Mineral Sampler.” Remediation Journal 33 (3): 209–16. https://doi.org/10.1002/rem.21752. ).
Min-Trap samples are analyzed using laboratory methods appropriate for soils. Some relevant analyses include extraction for total metals or characterization of iron sulfide (FeS, FeS2) minerals using the Aqueous and Mineral Intrinsic Bioremediation Assessment (AMIBA) suite ( Kennedy et al. 2004 [NXHF26RV] Kennedy, L., J. W. Everett, and J. Gonzales. 2004. “Aqueous and Mineral Intrinsic Bioremediation Assessment: Natural Attenuation.” Journal of Environmental Engineering 130 (9): 942–50. ), and spectroscopic analyses such as scanning electron microscopy with energy dispersive spectral analysis (SEM-EDS) and x-ray diffraction (XRD) for mineralogical characterization. The applicability of XRD analysis may be limited due to the relatively high quantity of mineral precipitates required for detection (typically greater than 1 percent by weight).
5.3.6.3 Advantages
- Min-Traps provide a reliable and cost-effective method for measuring the formation of reactive minerals in the subsurface.
- The Min-Trap sampling approach can be adapted to monitor the performance of essentially any treatment remedy where minerals are formed, dissolved, or transformed, providing direct evidence of treatment without additional drilling.
- For CVOC sites, confirmation of the formation of reactive, reduced iron minerals (for example, FeS, FeS2) in situ can be a key line of evidence to evaluate the synergy between biological and abiotic processes, support remedy optimization by indicating the need to increase or decrease injection frequency, and provide a basis for the transition from active treatment to a monitored natural attenuation approach.
- For sites where metals treatment via precipitation is the remedy, such as enhanced precipitation of hexavalent chromium or uranium, data collected from Min-Traps provide direct confirmation that the target precipitation activity is occurring. Min-Trap data can also be used to proactively evaluate the ongoing stability of mineral precipitates once formed without the need for repeated drilling events.
5.3.6.4 Limitations
- The failure to detect minerals that are forming in the aquifer in the Min-Traps (that is, “false negative”) is the most likely limitation and could be the result of inadequate deployment times and/or elevated mineral detection limits (for example, typically >1 percent by weight for XRD).
- Degradation of reactive minerals by oxygen during sampling, transport, and analysis may result in lost or misrepresentative data; however, this limitation can be addressed by using the recommended sample preservation protocol that includes steps to minimize oxygen exposure during transport. Field testing of this protocol indicated minor loss of target minerals (that is, iron sulfides) during sampling and short-term storage ( Ulrich et al. 2021 [66YF5YT4] Ulrich, Shannon, Jennifer Martin Tilton, Shandra Justicia‐Leon, et al. 2021. “Laboratory and Initial Field Testing of the Min‐TrapTM for Tracking Reactive Iron Sulfide Mineral Formation during in Situ Remediation.” Remediation Journal 31 (3): 35–48. https://doi.org/10.1002/rem.21681. ).
5.3.7 Radiello Sampler
5.3.7.1 Description and Application
Radiello (Figure 5-40) is a trade name of cylindrical, concentration gradient–reliant samplers originally developed by Fondazione Salvatore Maugeri (Padova, Italy) and distributed by Millipore Sigma (Burlington, MA, U.S.), primarily for indoor air quality monitoring. As a diffusive sampler, this device takes in compounds from the surrounding media without the forced movement of air, such as would involve a pump.
In addition to indoor air, these samplers can be used to monitor personal breathing zones, industrial workplace air, and outdoor ambient air. The core parts of the Radiello sampling system consist of a sorbent-filled tube (adsorbent cartridge) inserted into a protective housing that allows for air diffusion (diffusive body). Several different adsorbent cartridges are available for different classes of compounds. Compounds that can be sampled include more than 70 VOCs, including BTEX (benzene), aldehydes, 1,3-butadine and isoprene, phenols, ozone, ammonia, nitrogen and sulfur dioxides, hydrogen sulfide, hydrochloric acid, and hydrofluoric acid.
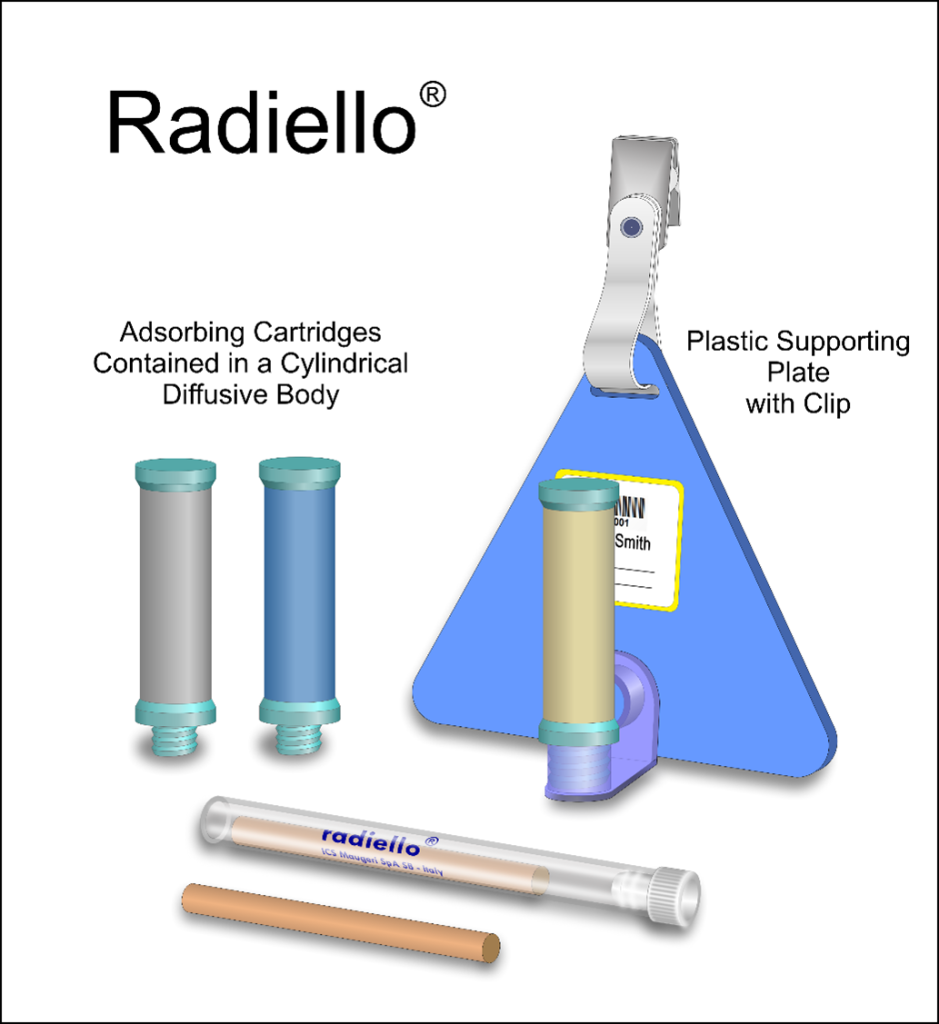
Figure 5-40. Radiello sampler.
Source: NJDEP, used with permission.
5.3.7.2 Installation and Use
The minimum requirements of the system include adsorbent cartridge, diffusive body, adhesive labels for sample tracking, and support plate for attaching diffusive body-cartridge assembly. The components may be purchased separately, or starter kits may be purchased that contain all the components of one complete sampler plus an additional adsorbent cartridge. Also available for purchase, Radiello ready-to-use diffusive samplers come preassembled with the adsorbent cartridge preloaded into the diffusive body that can be readily snapped into the preassembled adapter and support plate. Available optional accessories include outdoor shelter and in-field thermometer and reader.
The sampler is received from the supplier sealed in a glass tube. Prior to sampling, the adsorbent cartridge is transferred from the glass tube into an appropriate diffusive body, which is screwed onto a triangular support plate (either horizontally or vertically). Start date/time can be documented on sample identification label (with barcode) and inserted into sampler pocket.
The adsorbent cartridge is selected based on the compound class of interest (refer to the product manual for the technology) and can consist of a pure adsorbent material or a chemically coated adsorbent. Each adsorbent cartridge is sealed in a glass or plastic tube, which is placed in a transparent, thermally sealed polyethylene bag. The adsorbent cartridge is loaded into the diffusive body and attached to the support plate. A tethered clip is used to attach the support plate to a desired location, for example, to hang from a stand (ambient air monitoring) or clipped to a garment (for breathing zone monitoring).
The diffusive bodies are cylindrical diffusive barriers threaded at one end so they can be attached to the support plate. Vertical adapters (to orient the diffusive body to be parallel to the triangular support plate) can also be used (shown in Figure 5-40). When needed, the diffusive bodies can be reused and cleaned with a mild detergent as they will collect dust, especially during outdoor sampling. It is generally recommended to replace the diffusive body after four to five washings.
Four different diffusive bodies (white, RAD120; blue, RAD1201; yellow, RAD1202; and gray, RAD1203) are available, each used for specific adsorbent cartridges and applications (for example, the yellow diffusive body is indicated for use with thermal desorption cartridges for sampling of BTEX while the white diffusive body is indicated for use with solvent desorption cartridges for sampling of BTEX), as specified in the Radiello Manual.
Once the sampling period is complete, the adsorbent cartridge is transferred from the diffusive body back into the original sealed glass tube without touching the adsorbent itself. The end date/time and temperature can be documented on the label. The cartridge can be stored in a polyethylene bag after sampling before desorption/analysis. The cartridges are desorbed for analysis by chemical (solvent) or thermal extraction, depending on the specific cartridge. Although thermal desorption (TD) cartridge adsorbents may be used multiple times, the solvent-extracted adsorbent cartridge is designed for one-time use.
5.3.7.3 Advantages
- This hydrophobic sampler is well suited for humid environments by use of a diffusive body that is water repellent and applicable for outdoor air sampling when deployed beneath a shelter.
- The radial design of the Radiello allows airborne analytes 360° access to the diffusive surface and adsorbent material, resulting in a significantly higher uptake rate and faster sampling compared to traditional axial-type passive samplers.
- The diffusive body is said to be “touch- and chemically inert,” making them easy to handle. The diffusive body is water repellent and applicable in wet weather. Available accessories such as the “outdoor shelter” box protect the sampler from unfavorable weather conditions.
- Different adsorbents may be used based on the target compounds of concern. Higher sampling volumes, greater adsorbent capacity, and higher uptake rate reportedly contribute to minimal reverse diffusion and greater uptake rate consistency, which will result in more reproducible results.
- Uptake rates are the amount of a chemical adsorbed to a sorbent material per time. Instead of being calculated, uptake rates are measured under a range of conditions (chemical concentration, temperature, relative humidity, air speed, with and without interfering compounds, etc.), resulting in more precise quantification.
- The raw materials and each lot of finished products are quality compliance–checked to ensure low background contamination noise levels and ensure that performance standards are met.
- The high uptake rates and high capacity allow sampling time from 15 minutes to weeks, while achieving low reporting limits and a broad concentration range (1ppb–1,000 ppm).
- The Radiello system predominantly uses solvent/chemical desorption, and therefore does not require thermal desorption equipment. Thermal desorption and gas chromatography/mass spectrometry (TD-GC/MS) systems are also available for precise and very sensitive measurements using the RAD145 adsorbent cartridge.
5.3.7.4 Limitations
- Uptake rates can be obtained by comparison to experimental measurements by other sampling methods (for example, active sampling or real-time monitoring instruments) or to theoretical models. In a review study, Lutes et al. ( Lutes et al. 2010 [MYFHCPTL] Lutes, Christopher, Carl Singer, Robert Uppencamp, Ronald Mosley, and Dale Greenwell. 2010. “Radon Tracer as a Multipurpose Tool to Enhance Vapor Intrusion Assessment and Mitigation.” https://events.awma.org/education/Posters/Final/Lutes_RadonPoster.pdf. ) compared both thermally and solvent-extracted Radiello samplers with TO-15 samples and reported TO-15 results to be overall slightly higher than those from the Radiello samplers ( Lutes et al. 2010 [MYFHCPTL] Lutes, Christopher, Carl Singer, Robert Uppencamp, Ronald Mosley, and Dale Greenwell. 2010. “Radon Tracer as a Multipurpose Tool to Enhance Vapor Intrusion Assessment and Mitigation.” https://events.awma.org/education/Posters/Final/Lutes_RadonPoster.pdf. ). They also reported poor agreement between Radiello samplers and TO-15 samples for polar compounds—vinyl chloride, for example.
- A singular adsorbent is used, which cannot target very volatile organic compounds, such as vinyl chloride and 1,1-dichloroethene.
- To accurately determine chemical concentrations derived from passive samples, uptake rates are needed. These uptake rates are specific for the compound of interest, the sorbent material, and the sampling duration.
- The uptake rate of passive samplers is affected by environmental parameters such as wind velocity, relative humidity, and temperature. The effective uptake rate under field conditions can differ from the predicted uptake rate obtained under experimental conditions. Therefore, measurements of these sampling conditions must be recorded during the sampling period and accounted for when evaluating the measured concentration of analytes. A study published by Delgado Saborit and Esteve Cano ( Delgado Saborit and Esteve Cano 2007 [P2R22JBN] Delgado Saborit, J. M., and V. J. Esteve Cano. 2007. “Field Comparison of Passive Samplers versus UV-Photometric Analyser to Measure Surface Ozone in Mediterranean Area.” J Environ Monit, no. 9: 610–15. ) noted that while the Radiello passive samplers performed comparably to the UV-photometric ozone analyzer in measurements of ground-level ozone, one disadvantage was the requirement to determine the effective collection rate of the sampler itself ( Delgado Saborit and Esteve Cano 2007 [P2R22JBN] Delgado Saborit, J. M., and V. J. Esteve Cano. 2007. “Field Comparison of Passive Samplers versus UV-Photometric Analyser to Measure Surface Ozone in Mediterranean Area.” J Environ Monit, no. 9: 610–15. ). However, they noted the passive samplers could be calibrated against an automatic sampler as a reference of the collection rate efficiency for each sampling period.
- Highly variable ambient chemical concentrations may not be predicted by the controlled conditions used to obtain experimental uptake rate. For example, the presence of other chemicals, and at high ambient concentrations, may interfere with the adsorption of another.
- Passive uptake of a chemical from media is only linear (constant uptake rate) when the concentration of the chemical on the sampler is low. The uptake rate slows as the chemical concentration on the sampler increases and approaches equilibrium. There is no net uptake onto the passive sampler when the sampler reaches equilibrium. However, the Radiello sampler contains a large mass of sorbent to minimize the potential for sorbent saturation.
- Another review ( Wania and Shunthirasingham 2020 [2Y48NJSC] Wania, F., and C. Shunthirasingham. 2020. “Passive Air Sampling for Semi-Volatile Organic Chemicals.” Environmental Science: Processes & Impacts 22 (10): 1925. https://pubs.rsc.org/en/content/articlelanding/2020/em/d0em00194e#! ) of passive air sampling of SVOCs suggested that the Radiello diffusive bodies made of polyethylene are themselves capable of adsorbing SVOCs and interfering with diffusion into the sorbent. Overall, the review concluded that there was much quantitative uncertainty in passive air sampling of SVOCs.
- Compared to thermal desorption, the solvent desorption method requires additional sample preparation steps with potential for analytical interference from formation of artifacts. The solvent extraction method also has lower desorption efficiency compared to the thermal desorption method. Lack of automation is one drawback for the solvent desorption method.
- Compared to the solvent desorption method, thermal desorption requires high temperatures for effective release of sorbed compounds, which could lead to degradation of certain compounds and even some sorbent materials. However, the thermal desorption method may be automated, unlike the solvent desorption method.
5.3.8 Waterloo Membrane Sampler (Solvent-extracted)
5.3.8.1 Description and Application
The Waterloo Membrane Sampler (WMS) (Figure 5-41) is a “tube-style permeation passive sampler” used for sampling indoor/outdoor air and soil gas and is designed with a thin hydrophobic polydimethylsiloxane (PDMS) membrane placed across the face of a sorbent-filled vial ( Grosse et al. 2014 [W8ZJYUK8] Grosse, Doug, Robert Truesdale, Heidi Hayes, Dr. Helen Dawson, Dr. Todd McAlary, and Chris Lutes. 2014. Passive Samplers for Investigations of Air Quality: Method Description, Implementation, and Comparison to Alternative Sampling Methods. EPA/600/R-14/434. With John H. Zimmerman, Rich Kapusinski, and Dr. Henry Schuver. National Risk Management Research Laboratory. https://nepis.epa.gov/Exe/ZyNET.exe/P100MK4Z.TXT?ZyActionD=ZyDocument&Client=EPA&Index=2011+Thru+2015&Docs=&Query=&Time=&EndTime=&SearchMethod=1&TocRestrict=n&Toc=&TocEntry=&QField=&QFieldYear=&QFieldMonth=&QFieldDay=&IntQFieldOp=0&ExtQFieldOp=0&XmlQuery=&File=D%3A%5Czyfiles%5CIndex%20Data%5C11thru15%5CTxt%5C00000015%5CP100MK4Z.txt&User=ANONYMOUS&Password=anonymous&SortMethod=h%7C-&MaximumDocuments=1&FuzzyDegree=0&ImageQuality=r75g8/r75g8/x150y150g16/i425&Display=hpfr&DefSeekPage=x&SearchBack=ZyActionL&Back=ZyActionS&BackDesc=Results%20page&MaximumPages=1&ZyEntry=1&SeekPage=x&ZyPURL#. ). The type of sorbent used can be either a very strong sorbent requiring solvent extraction (charcoal type) or a weak absorbent amenable to thermal desorption (graphite carbon black type); however, currently a thermal desorption option is not available. Solvent extraction laboratory preparation methods result in lower analytical sensitivity and therefore a requirement for longer sample duration than thermal desorption methods with higher analytical sensitivity that require shorter sample duration. VOC vapors permeate through the PDMS membrane, which is itself a sorptive material, and are trapped by the sorbent medium inside the vial. The mass of each chemical is determined by gas chromatography–mass spectrometry (GC-MS) and a time-weighted average concentration can be calculated using experimentally measured validated uptake rates for many common VOCs. As stated by SiREM, concentrations in the sampled air can be calculated as show in Equation 6 ( SiREM [NX77826D] SiREM. n.d. “Instructions for Soil Gas Sampling with WMS-LU TM Samplers.” ttps://www.siremlab.com/waterloo-membrane-sampler-wms/. ):
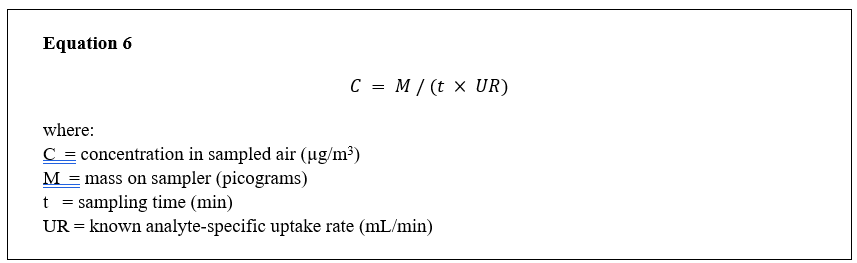
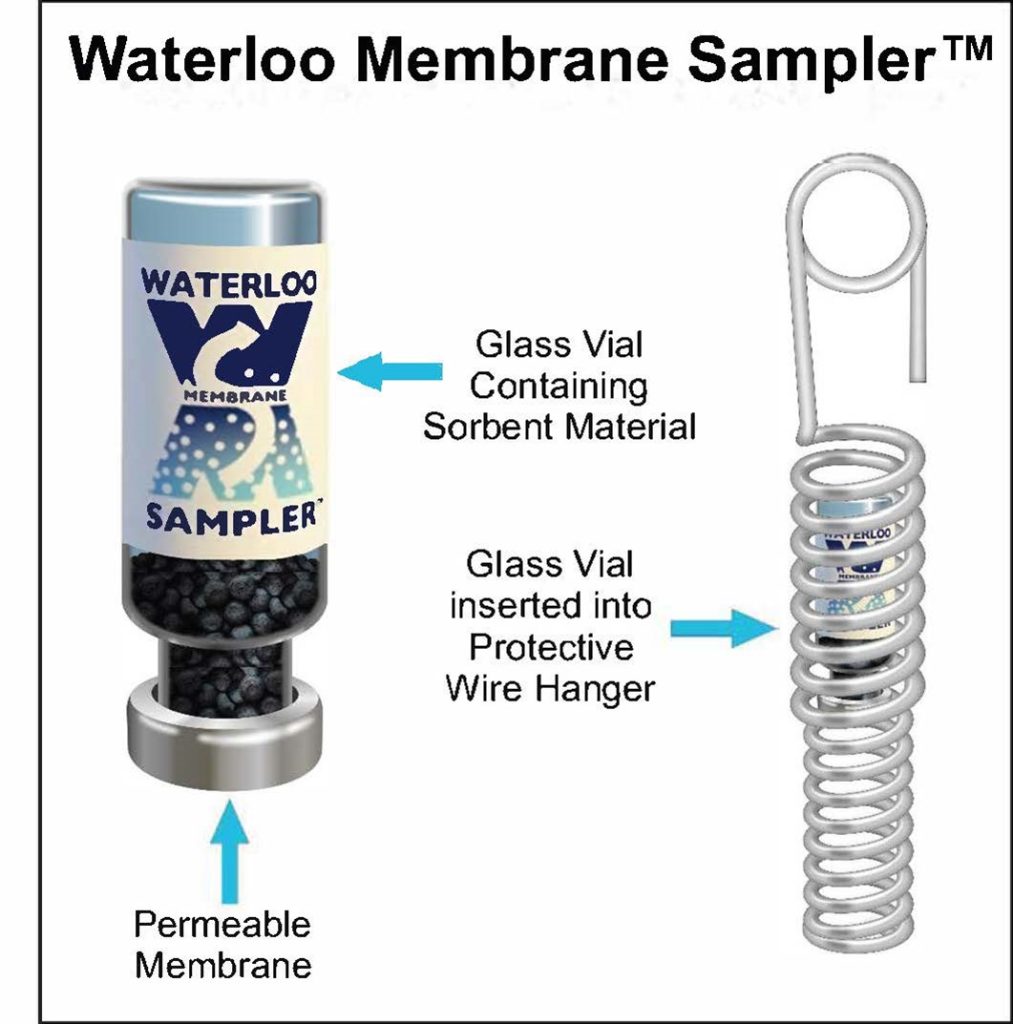
Figure 5-41. Waterloo Membrane Sampler.
Source: NJDEP, used with permission.
5.3.8.2 Installation and Use
The following summary of the instructions on installation and use of the WMS were taken from SiREM for collecting indoor and outdoor air samples. Detailed instructions and additional instructions for soil gas sampling are on the SiREM website.
The sampler is shipped in a thermally sealed polycoated aluminum pouch and should not be opened until the sampler is ready for use (Figure 5-42) to prevent cross contamination. Within the pouch is a glass vial that has the WMS sampler and a carbon pack “MiniPax” (a), a wire hanger (to deploy the sampler) (b), a nylon line (approximately 10 feet) to help with deployment (c), and Teflon tape for re-sealing the glass vial once the sample has been collected (c) (Figure 5-41) ( SiREM [IEGWILFI] SiREM. n.d. “Directions for Collecting Indoor and Outdoor Air Samples with the Waterloo Membrane Sampler TM.” https://siremlab.com/wp-content/uploads/2021/02/WMS-SOP-passive-air-sampling.pdf. ).
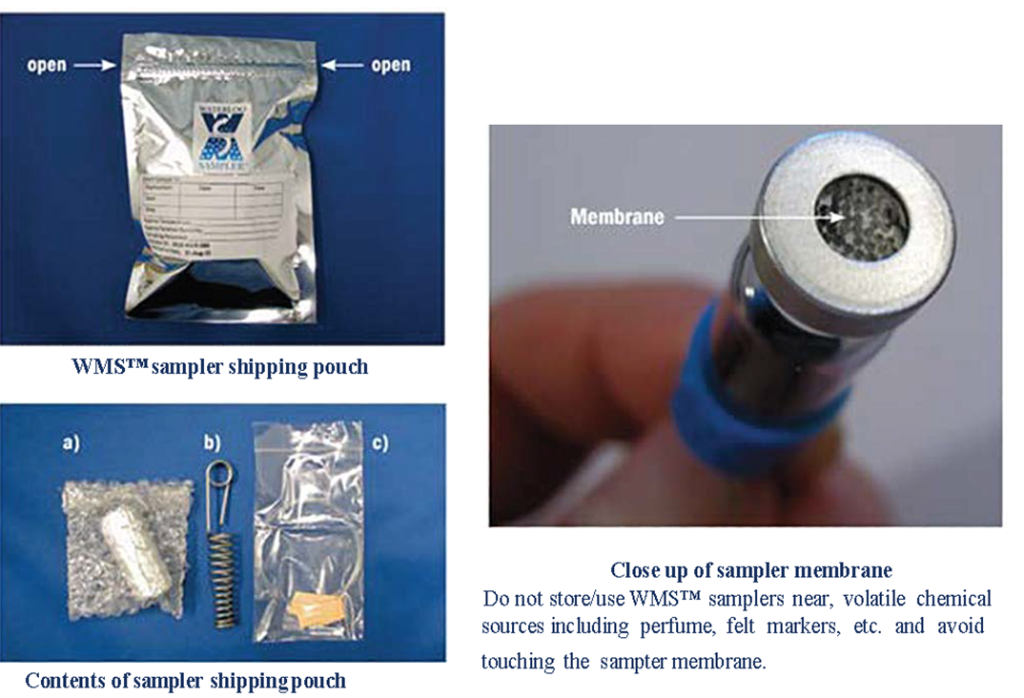
Figure 5-42. The Waterloo Membrane Sampler.
Source: SiREM, adapted with permission.
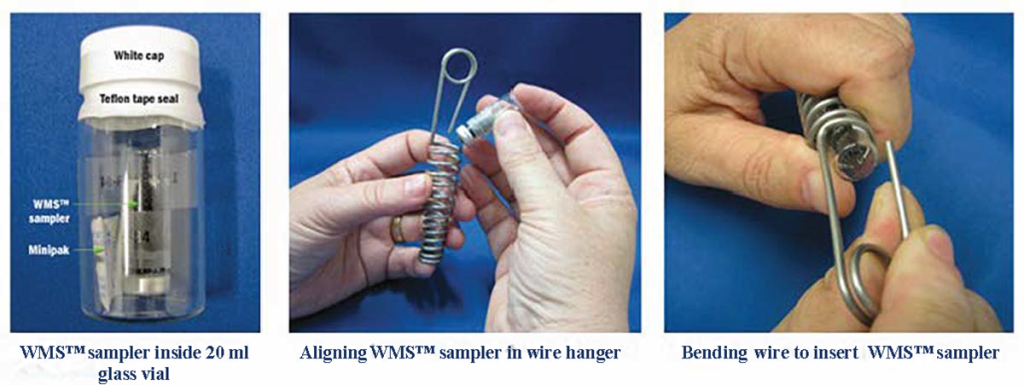
Figure 5-43. The WMS being prepped for deployment.
Source: SiREM, adapted with permission.
After removing the sampler from the glass vial, position the sampler upside down and insert into the wire hanger (Figure 5-43). Hang the sampler at the desired location using the nylon line and wire loops at the top of the wire hanger, with the membrane facing downward (Figure 5-43) ( SiREM [IEGWILFI] SiREM. n.d. “Directions for Collecting Indoor and Outdoor Air Samples with the Waterloo Membrane Sampler TM.” https://siremlab.com/wp-content/uploads/2021/02/WMS-SOP-passive-air-sampling.pdf. ). Once sampling is complete, remove the sampler from the wire hanger (Figure 5-44). Next, take out the MiniPax from the 20 mL glass vial and place it in the aluminum pouch. Place the sampler back in the glass vial and seal with the cap and tape and put the vial in the bubble pack and place in the aluminum pouch and seal (Figure 5-44) ( SiREM [IEGWILFI] SiREM. n.d. “Directions for Collecting Indoor and Outdoor Air Samples with the Waterloo Membrane Sampler TM.” https://siremlab.com/wp-content/uploads/2021/02/WMS-SOP-passive-air-sampling.pdf. ).
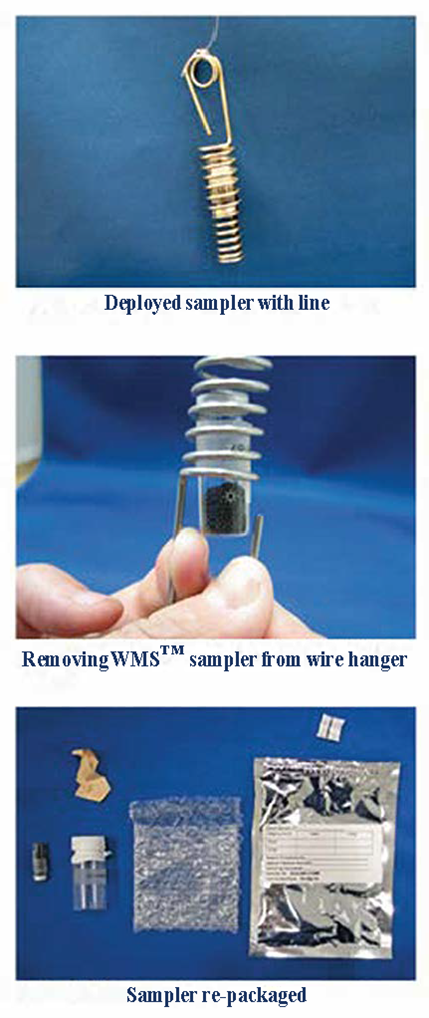
Figure 5-44. The WMS in deployment, retrieved, and repackaged.
Source: SiREM, adapted with permission.
5.3.8.3 Advantages
- Hydrophobic sampler is well suited for humid environments ( Seethapathy and Górecki 2010 [CQN9GTRX] Seethapathy, Suresh, and Tadeusz Górecki. 2010. “Polydimethylsiloxane-Based Permeation Passive Air Sampler. Part II: Effect of Temperature and Humidity on the Calibration Constants.” Journal of Chromatography A 1217 (50): 7907–13. https://doi.org/10.1016/j.chroma.2010.10.057. ).
- For soil gas sampling, leaks in sampling trains are not a concern compared to active sampling methods and no leak check procedures are required ( Dawson et al. 2015 [CC38ULK2] Dawson, Helen, Todd McAlary, and Hester Groenevelt. 2015. Passive Sampling for Vapor Intrusion Assessment. Technical Memorandum TM-NAVFAC EXWC-EV-1503. https://www.siremlab.com/wp-content/uploads/2021/02/NAVFAC-2015-Passive-Sampling-for-Vapor-Intrusion-Assessment.pdf. ).
- The Waterloo Membrane Sampler is insensitive to wind velocity (beneficial for outdoor and mitigation vent-pipe monitoring or soil vapor extraction system sampling) ( Seethapathy 2009 [XCTW4YI2] Seethapathy, Suresh. 2009. “Development, Validation, Uptake Rate Modeling and Field Applications of a New Permeation Passive Sampler.” University of Waterloo. http://hdl.handle.net/10012/4870. ).
- Thickness and porosity of PDMS membrane can be modified to vary the sampler uptake rates so they are less than the lowest expected soil gas replenishment rate when sampling soil gas in low soil permeability conditions. However, new uptake rates will need to be determined for the modified sampler through an uptake rate validation study or estimation by theoretical determination. Known or expected geologic or other environmental conditions that will reduce the diffusion rate of gases should be noted by the field team ( Seethapathy and Górecki 2010 [CQN9GTRX] Seethapathy, Suresh, and Tadeusz Górecki. 2010. “Polydimethylsiloxane-Based Permeation Passive Air Sampler. Part II: Effect of Temperature and Humidity on the Calibration Constants.” Journal of Chromatography A 1217 (50): 7907–13. https://doi.org/10.1016/j.chroma.2010.10.057. ; McAlary et al. 2014 [2XRXDAA5] McAlary, Todd, Xiaomin Wang, Andre Unger, Hester Groenevelt, and Tadeusz Górecki. 2014. “Quantitative Passive Soil Vapor Sampling for VOCs--Part 1: Theory.” Environmental Science. Processes & Impacts 16 (3): 482–90. https://doi.org/10.1039/c3em00652b. ; McAlary et al. 2014 [X2WJXVHU] McAlary, Todd, Hester Groenevelt, Suresh Seethapathy, et al. 2014. “Quantitative Passive Soil Vapor Sampling for VOCs--Part 2: Laboratory Experiments.” Environmental Science. Processes & Impacts 16 (3): 491–500. https://doi.org/10.1039/c3em00128h. ; McAlary et al. 2014 [AGSA9AEW] McAlary, Todd, Hester Groenevelt, Paul Nicholson, et al. 2014. “Quantitative Passive Soil Vapor Sampling for VOCs--Part 3: Field Experiments.” Environmental Science. Processes & Impacts 16 (3): 501–10. https://doi.org/10.1039/c3em00653k. ).
- The Waterloo Membrane Sampler can fit within a subslab vapor point for leakproof subslab monitoring ( Vachon 2023 [36H87MW5] Vachon, Melody. 2023. “Waterloo Membrane Sampler.” SiREM LAB, November 27. https://www.siremlab.com/waterloo-membrane-sampler/. ).
5.3.8.4 Limitations
- For soil gas sampling, low soil permeability conditions can result in the uptake of VOCs in the vapor phase at a greater rate than the replenishment rate of VOCs. This condition would also result in a sorbent pumped tube or an evacuated canister’s inability to collect a sample due to a vacuum being created.
- Sampler must be suspended vertically so adsorbent within vial covers the entire surface of the PDMS membrane.
- Saturation of the sampler could occur due to exposure to high chemical concentrations over an extended period of time ( Salim et al. 2019 [ZTWIWSZJ] Salim, Faten, Marios Ioannidis, Alexander Penlidis, and Tadeusz Górecki. 2019. “Modelling Permeation Passive Sampling: Intra-Particle Resistance to Mass Transfer and Comprehensive Sensitivity Analysis.” Environmental Science. Processes & Impacts 21 (3): 469–84. https://doi.org/10.1039/c8em00565f. ).
- Competition could develop between strongly adsorbing VOCs displacing less strong ( Dawson et al. 2015 [CC38ULK2] Dawson, Helen, Todd McAlary, and Hester Groenevelt. 2015. Passive Sampling for Vapor Intrusion Assessment. Technical Memorandum TM-NAVFAC EXWC-EV-1503. https://www.siremlab.com/wp-content/uploads/2021/02/NAVFAC-2015-Passive-Sampling-for-Vapor-Intrusion-Assessment.pdf. ; Salim et al. 2019 [ZTWIWSZJ] Salim, Faten, Marios Ioannidis, Alexander Penlidis, and Tadeusz Górecki. 2019. “Modelling Permeation Passive Sampling: Intra-Particle Resistance to Mass Transfer and Comprehensive Sensitivity Analysis.” Environmental Science. Processes & Impacts 21 (3): 469–84. https://doi.org/10.1039/c8em00565f. ).
- Poor recovery can occur from use of strong sorbent with strongly sorbed compounds that are not completely released from the sorbent during analysis ( Dawson et al. 2015 [CC38ULK2] Dawson, Helen, Todd McAlary, and Hester Groenevelt. 2015. Passive Sampling for Vapor Intrusion Assessment. Technical Memorandum TM-NAVFAC EXWC-EV-1503. https://www.siremlab.com/wp-content/uploads/2021/02/NAVFAC-2015-Passive-Sampling-for-Vapor-Intrusion-Assessment.pdf. ; McAlary 2015 [MSK5T38A] McAlary, Todd. 2015. Development of More Cost-Effective Methods for Long-Term Monitoring of Soil Vapor Intrusion to Indoor Air Using Quantitative Passive Diffusive-Adsorptive Sampling Techniques. Cost and Performance Report ER-200830. SERDP and ESTCP. https://apps.dtic.mil/sti/pdfs/ADA621730.pdf. ).
- Compared to thermal desorption, the solvent desorption method requires additional sample preparation steps with potential for analytical interference from formation of artifacts. The solvent extraction method also has lower desorption efficiency compared to the thermal desorption method. Lack of automation is one drawback for the solvent desorption method.
- Some components of this sampler may contain PFAS, which should be considered based on project DQOs.
5.3.9 Beacon Sampler
5.3.9.1 Description and Application
Beacon samplers (Figure 5-45) are a trade name of the passive adsorbent samplers developed and provided by Beacon Environmental (Bel Air, MD). They can be used for both air and soil gas sampling, as well as in conduits (for example, sewer lines) and vapor extraction piping. The samplers contain two pairs of hydrophobic carbonaceous adsorbents in an inert container with an opening of known dimension that all VOC vapors pass through at a constant (and known) rate ( Grosse et al. 2014 [W8ZJYUK8] Grosse, Doug, Robert Truesdale, Heidi Hayes, Dr. Helen Dawson, Dr. Todd McAlary, and Chris Lutes. 2014. Passive Samplers for Investigations of Air Quality: Method Description, Implementation, and Comparison to Alternative Sampling Methods. EPA/600/R-14/434. With John H. Zimmerman, Rich Kapusinski, and Dr. Henry Schuver. National Risk Management Research Laboratory. https://nepis.epa.gov/Exe/ZyNET.exe/P100MK4Z.TXT?ZyActionD=ZyDocument&Client=EPA&Index=2011+Thru+2015&Docs=&Query=&Time=&EndTime=&SearchMethod=1&TocRestrict=n&Toc=&TocEntry=&QField=&QFieldYear=&QFieldMonth=&QFieldDay=&IntQFieldOp=0&ExtQFieldOp=0&XmlQuery=&File=D%3A%5Czyfiles%5CIndex%20Data%5C11thru15%5CTxt%5C00000015%5CP100MK4Z.txt&User=ANONYMOUS&Password=anonymous&SortMethod=h%7C-&MaximumDocuments=1&FuzzyDegree=0&ImageQuality=r75g8/r75g8/x150y150g16/i425&Display=hpfr&DefSeekPage=x&SearchBack=ZyActionL&Back=ZyActionS&BackDesc=Results%20page&MaximumPages=1&ZyEntry=1&SeekPage=x&ZyPURL#. ). The concentration gradient from the surroundings to the sorbent provides the driving force for diffusion of VOC vapors into the sampler.
Beacon passive samplers are deployed for a designated sampling period, typically ranging from days to weeks, and then collected and analyzed by thermal desorption extraction of the VOCs from the sorbent to measure the sorbed mass of each chemical during the sampling period. Beacon’s passive sampling procedures are in accordance with ASTM standards D5314 & D7758. As stated in USEPA 2014, the average concentration over the sampling period can be calculated as follows (Equation 7):
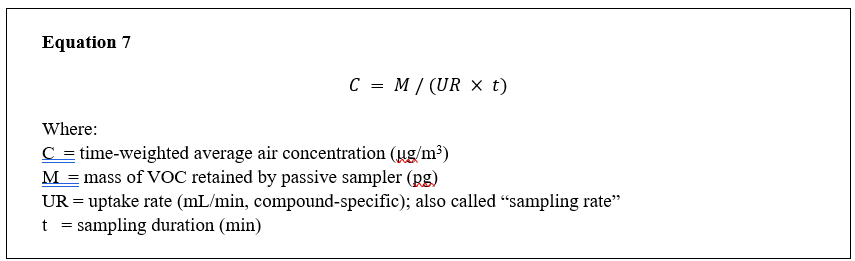
Sampling duration can be measured with high levels of accuracy, and the mass of VOC retained is analyzed by thermal desorption–gas chromatography/mass spectrometry (TD-GC/MS) following accredited USEPA Method 8260D, TO-17, 325B, or TO-15 ( Clark et al. 2008 [LACT2FJJ] Clark, James N., Deborah Goodwin, Harry O’Neill, and Joseph E. Odencrantz. 2008. “Application of Passive Soil Gas Technology to Determine the Source and Extent of a PCE Groundwater Plume in an Urban Environment.” Journal of Remediation-In Press, July, 8. https://beacon-usa.com/wp-content/uploads/2021/05/Regional-Groundwater-Investigation.pdf. ). Accordingly, the uptake rate (sampling rate) is the most critical variable for accurately determining air concentrations when using any passive samplers ( Grosse et al. 2014 [W8ZJYUK8] Grosse, Doug, Robert Truesdale, Heidi Hayes, Dr. Helen Dawson, Dr. Todd McAlary, and Chris Lutes. 2014. Passive Samplers for Investigations of Air Quality: Method Description, Implementation, and Comparison to Alternative Sampling Methods. EPA/600/R-14/434. With John H. Zimmerman, Rich Kapusinski, and Dr. Henry Schuver. National Risk Management Research Laboratory. https://nepis.epa.gov/Exe/ZyNET.exe/P100MK4Z.TXT?ZyActionD=ZyDocument&Client=EPA&Index=2011+Thru+2015&Docs=&Query=&Time=&EndTime=&SearchMethod=1&TocRestrict=n&Toc=&TocEntry=&QField=&QFieldYear=&QFieldMonth=&QFieldDay=&IntQFieldOp=0&ExtQFieldOp=0&XmlQuery=&File=D%3A%5Czyfiles%5CIndex%20Data%5C11thru15%5CTxt%5C00000015%5CP100MK4Z.txt&User=ANONYMOUS&Password=anonymous&SortMethod=h%7C-&MaximumDocuments=1&FuzzyDegree=0&ImageQuality=r75g8/r75g8/x150y150g16/i425&Display=hpfr&DefSeekPage=x&SearchBack=ZyActionL&Back=ZyActionS&BackDesc=Results%20page&MaximumPages=1&ZyEntry=1&SeekPage=x&ZyPURL#. ).
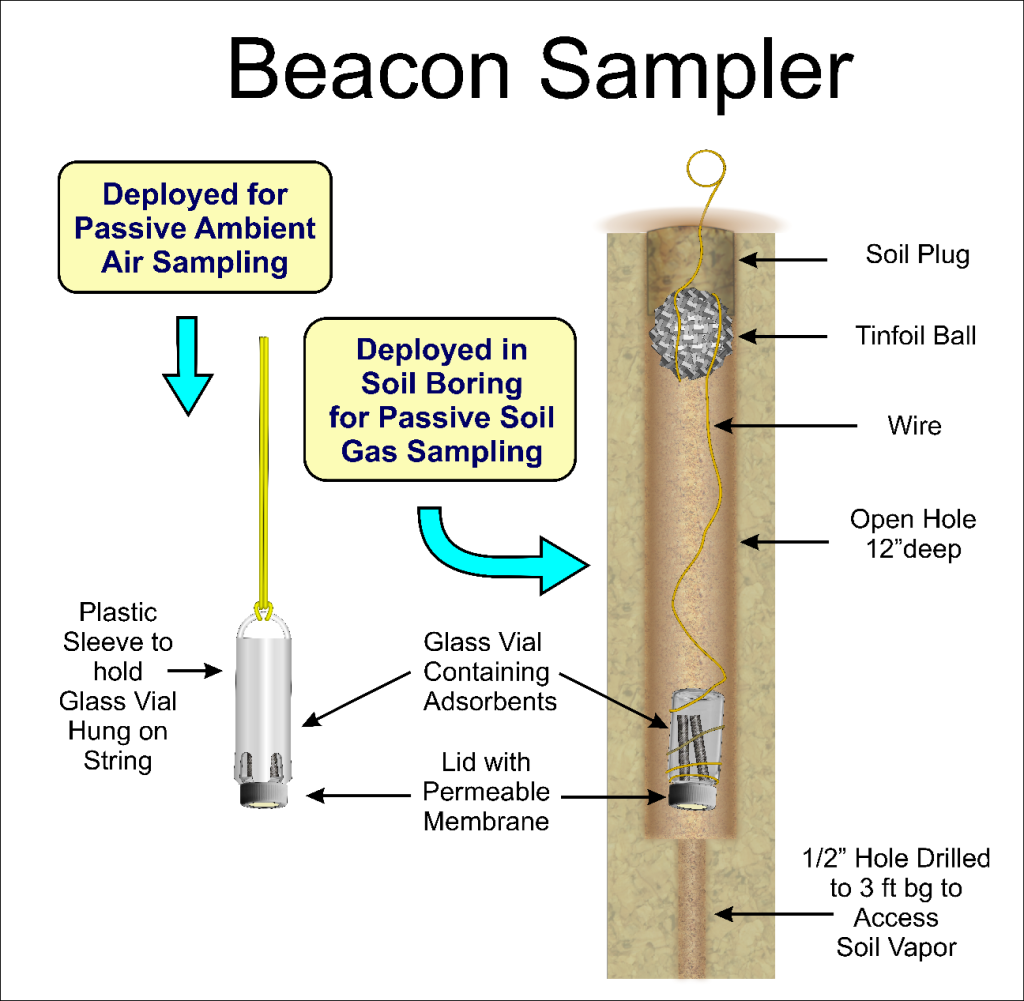
Figure 5-45. Beacon sampler.
Source: NJDEP, used with permission.
5.3.9.2 Installation and Use
Passive soil gas (PSG) sampler
Beacon PSG samplers can be installed (Figure 5-46) to various depths depending on the project objectives. A standard approach involves drilling a 1½-inch diameter hole to a depth of 12–14 inches and a ½-inch hole to a depth of 36 inches. A 12-inch length of pipe is then installed into the larger hole so that it rests ½ inch below grade. A Beacon PSG sampler is next installed open-end down, into the pipe so that it rests at the bottom of the pipe. The hole above the pipe is plugged with an aluminum foil ball and covered to grade with soil or a thin ½-inch concrete patch when sampling through impervious surfacing. As an option, a mechanical plug can be used to seal the hole through impervious surfacing during the sampling period and between sampling events. The dates and times of deployment and retrieval of each sampler are recorded on the chain of custody that is returned with the samples to Beacon for analysis following analytical procedures described in USEPA Method TO-17 and TO-15 to target a range of compounds from vinyl chloride to lighter PAHs. The holding time from sample collection until analysis is 30 days, and no ice or preservatives are required during shipment.
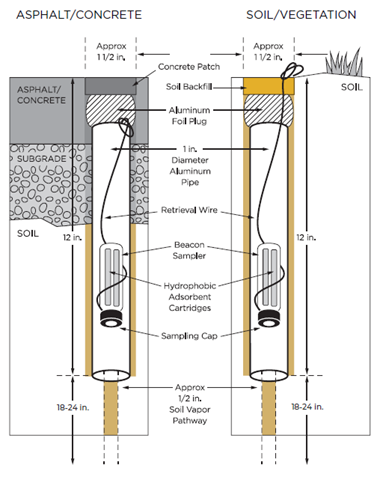
Figure 5-46. Beacon sampler installation.
Source: Beacon Environmental, used with permission.
Beacon passive air sampler
To prepare a Beacon passive air sampler, cut a piece of string long enough to hang the sampler at the desired height and place the string within easy reach. Replace the white solid cap on the sampler with a black sampling cap (a one-hole cap with a screen meshing insert). Remove one of the Beacon samplers (a glass vial containing two sets of hydrophobic absorbent cartridges) from the sampler bag. Slide the sampler into the Beacon sampler holder all the way or until it clicks into place, with the sampling cap facing out from the holder. Secure the string to the holder to suspend the sampler. For indoor air, the sampler is suspended in the air typically within the breathing zone. The sampler can also be used to sample gas in conduits (for example, sewer lines) and vapor extraction piping, as well as outdoor air. Following the sampling period, the sampling cap is removed and replaced with the solid shipping cap, which is tightened to be gas-tight. The dates and times of deployment and retrieval of each sampler are recorded on the chain of custody that is returned with the samples to Beacon for analysis following analytical procedures described in USEPA Method TO-17 and TO-15 to target a range of compounds from vinyl chloride to lighter PAHs. The holding time from sample collection until analysis is 30 days and no ice or preservatives are required during shipment.
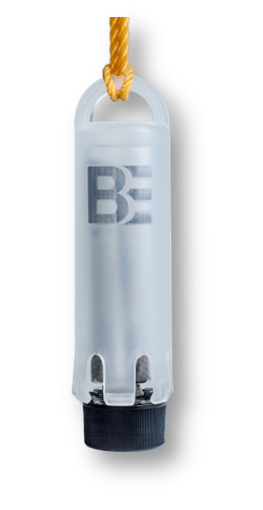
Figure 5-47. Beacon passive air sampler.
Source: Beacon Environmental, used with permission.
ChloroSorber passive sampler
The ChloroSorber sampler (Figure 5-48) targets a range of chlorinated compounds from vinyl chloride to tetrachloroethene with low-level detection limits in air or sewer gas. Sample collection instructions to be followed can be found on the Beacon website ( 2024 [MCKU7F6J] “Instructions - Beacon Environmental.” 2024. https://beacon-usa.com/resources/instructions/. ). To sample air, the storage cap is removed from the sampling end of the tube and replaced with a diffusion cap that allows air to enter the tube and the VOCs present to be adsorbed onto the sorbent bed following the principles of diffusion. The sampler is suspended in the air by wire or string typically within the breathing zone for indoor air samples. The ChloroSorber can also be used to sample gas in conduits (for example, sewer lines) and vapor extraction piping, as well as outdoor air. Following the sampling period, the diffusion cap is removed and replaced with the storage cap, which is tightened to be gas-tight for storage and transport. The dates and times of deployment and retrieval of each sampler are recorded on the chain of custody that is returned to Beacon with the samples for analysis following analytical procedures described in USEPA Method TO-17 and TO-15 to target a range of chlorinated compounds from vinyl chloride to tetrachloroethene at low trace reporting limits. The holding time from sample collection until analysis is 30 days and no ice or preservatives are required during shipment.
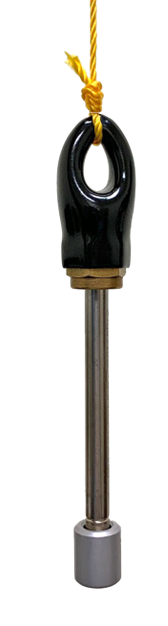
Figure 5-48. ChloroSorber sampler.
Source: Beacon Environmental, used with permission.
5.3.9.3 Advantages
- Data are reported in units of concentration (μg/m3). Quantitative uptake rates were experimentally determined and validated for the Beacon sampler and ChloroSorber in a third-party study that included other passive samplers with known uptake rates as a reference and was completed over 7-, 14-, and 26-day exposure periods. The experiments were carried out by the Health and Safety Executive (HSE), United Kingdom, in a standard atmosphere generator based upon procedures described in ISO 6145-4:20042. HSE’s methods for the determination of hazardous substances are the source of most of the published uptake rates in the relevant international standard methods (for example, ISO 16017-2)3. Quantitative uptake rates for 13 key chlorinated and aromatic VOCs were determined and verified for the passive samplers. In this six-replicate third-party study, the devices showed excellent performance with great linearity and reproducibility.
- The Beacon sampler contains two different hydrophobic adsorbents enabling the sampler to be used to target a broad range of organic compounds with one analysis from vinyl chloride to the lighter polycyclic aromatic hydrocarbons PAHs, such as naphthalene, acenaphthene, and fluorene. The use of two adsorbents extends the range of target analytes beyond other passive samplers that use only one adsorbent.
- The hydrophobic sampler is well suited for humid environments by use of hydrophobic adsorbents. As noted in ISO 16017-2, passive samplers are suitable for use in atmospheres of up to 95% relative humidity for all hydrophobic sorbents ( 2003 [G9KAUVKL] “Indoor, Ambient and Workplace Air - Sampling and Analysis of Volatile Organic Compounds by Sorbent Tube/Thermal Desorption/Capillary Gas Chromatography - Part 2: Diffusive Sampling.” 2003. The International Organization for Standardization (ISO). https://webstore.ansi.org/standards/iso/iso160172003. ).
- Beacon samplers have simple application and installation. All materials for sampling procedures are provided in a well-organized sampling kit with detailed instructions.
- Analyses of all samples are completed by Beacon Environmental following accredited USEPA methods, and USDOD Environmental Laboratory Accreditation Program (ELAP) and/or National Environmental Laboratory Accreditation Program (NELAP) procedures.
- The ChloroSorber can target chlorinated compounds at low detection limits (for example < 0.04 μg/m3 for vinyl chloride with a 14-day sampling duration).
- For soil gas sampling, no sampling train is used, so no leak check procedures are required, as they are for active soil gas sampling.
- The sampler can be oriented vertically in either direction or horizontally for sample collection.
- Sampler shelters custom designed for the Beacon sampler and ChloroSorber are available for protection from weather when sampling outdoor air, in accordance with USEPA Method 325A requirements ( USEPA 2019 [7GAQZ5DE] USEPA. 2019. “Method 325A – Volatile Organic Compounds from Fugitive and Area Sources: Sampler Deployment and VOC Sample Collection.” USEPA. https://www.epa.gov/sites/default/files/2019-08/documents/method_325a.pdf. ).
- As an option, a mechanical plug used to suspend the soil gas sampler can seal the hole through impervious surfacing during the sampling period and between sampling events.
5.3.9.4 Limitations
- The detection limits are based on the sampling duration, and extended sampling periods may be required to meet target screening levels.
- Thirteen chlorinated VOCs were tested in the HSE laboratory for validated uptake rates, and Graham’s Law of gas diffusion is used to calculate the uptake rates for other VOCs. However, all chlorinated compounds targeted by the ChloroSorber were included in the HSE uptake rate study.
- For soil gas sampling, low soil permeability conditions can result in the uptake of VOCs in the vapor phase at a greater rate than the replenishment rate of VOCs. This condition would also result in a sorbent pumped tube or an evacuated canister’s inability to collect a sample due to a vacuum being created.
- Sample analysis is performed exclusively by Beacon Environmental. Third-party analysis is not available.
5.3.10 Dart Sampler
5.3.10.1 Description and Application
The Dart sampler (Figure 5-49) is a type of polymeric sampler used to delineate an area of interest for PAHs in sediments and similar soft soils. The technology is deployed when traditional mechanized sampling (such as laser-induced fluorescence (LIF), traditional soil borings, etc.) is limited by site constraints – potentially unsafe for mechanized sampling or where the site would be adversely affected by access for mechanized sampling This technique often applies to PAHs that exist as a component of NAPL in sediments but has been shown to apply to dissolved-phase PAHs as well ( Hawthorne et al. 2008 [PR83Y68P] Hawthorne, Steven B., Randy W. St. Germain, and Nicholas A. Azzolina. 2008. “Laser-Induced Fluorescence Coupled with Solid-Phase Microextraction for In Situ Determination of PAHs in Sediment Pore Water.” Environmental Science & Technology 42 (21): 8021–26. https://doi.org/10.1021/es8011673. ). Accordingly, the Dart sampler is especially useful for high-resolution NAPL characterization at sites where it can generally be difficult and expensive to profile NAPLs, such as shorelines, marshes, shallow bodies of water adjacent to refineries, or former manufactured gas plants or creosote sites ( Hawthorne et al. 2008 [PR83Y68P] Hawthorne, Steven B., Randy W. St. Germain, and Nicholas A. Azzolina. 2008. “Laser-Induced Fluorescence Coupled with Solid-Phase Microextraction for In Situ Determination of PAHs in Sediment Pore Water.” Environmental Science & Technology 42 (21): 8021–26. https://doi.org/10.1021/es8011673. ). The Dart sampler contains a rod coated with a nonfluorescing solid-phase extraction (SPE) media, which is also used in labs for USEPA–approved cleanup and preconcentration of PAHs in traditional grab samples ( [RR9P8B7W] Dakota Technologies. n.d. “Darts.” Accessed February 10, 2024. https://www.dakotatechnologies.com/products/darts. ). The technique relies on the fluorescing property of PAHs that have sorbed into the SPE material under excitation by ultraviolet laser light.
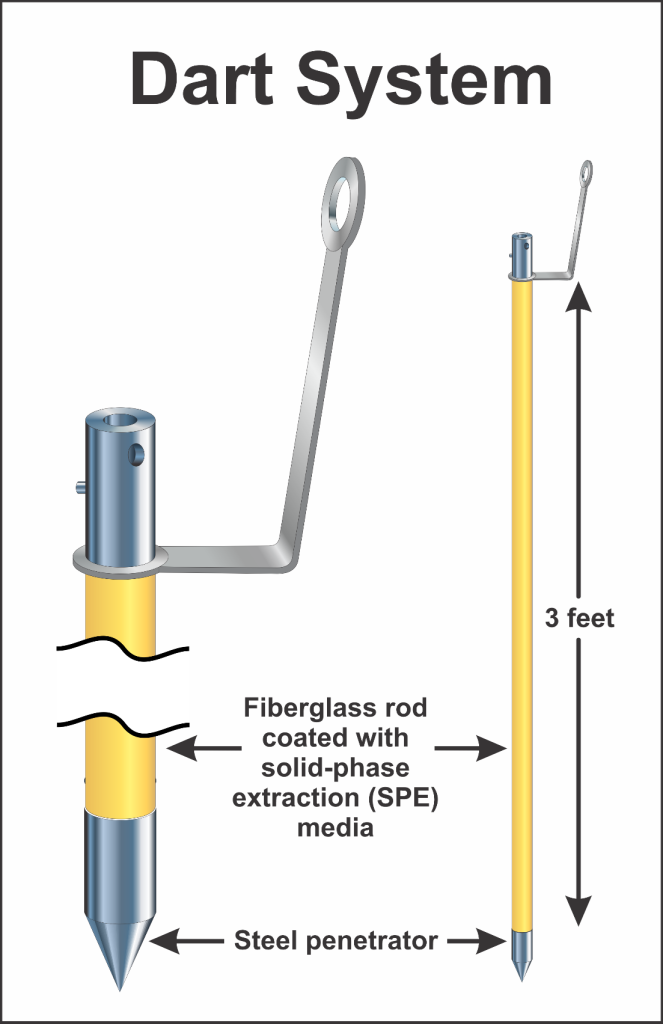
Figure 5-49. Dart sampler.
Source: NJDEP, used with permission.
5.3.10.2 Installation and Use
The Darts are driven 1–20 feet down into the sediments. The target depth depends on soil conditions or survey need. Three- and six-foot Darts are standard. Once the Darts are planted, PAHs are attracted to and absorbed into the SPE media because of the PAHs’ high affinity for the SPE material. Typically, 24–48 hours of equilibration time is adequate, after which the Darts are retrieved, wrapped in foil to isolate darts from each other, packaged, and sent to the manufacturer (Dakota Technologies (Dakota)) for reading. Once the PAHs have migrated into the Dart’s SPE coating, they are stored in solid solution and remain contained there. Refrigeration may not be needed.
The Darts are processed through an LIF reader by technicians from Dakota. The LIF and Dakota’s ultraviolet optical screening tool (UVOST) are very similar ( [RR9P8B7W] Dakota Technologies. n.d. “Darts.” Accessed February 10, 2024. https://www.dakotatechnologies.com/products/darts. ). A lathe-like device is used to rotate the Dart while the UVOST system logs a detailed reading of the PAH fluorescence (in units of %RE (reference emitter)) vs. depth, typically at very high resolution (>100 readings/ft) to “read” the sorbed PAHs’ fluorescence along the Dart’s entire length and circumference ( [RR9P8B7W] Dakota Technologies. n.d. “Darts.” Accessed February 10, 2024. https://www.dakotatechnologies.com/products/darts. ). The result is a LIF log that looks approximately identical to a UVOST log. Similar to UVOST, the LIF response correlates monotonically to the total-available-PAH content of the NAPL in sediment vs. depth and distinguishes between different petroleum product types. After processing, the clients are sent a JPG file of the graphical log and high-resolution data files.
5.3.10.3 Advantages
- Samples do not require ice or low temperature storage after collection.
- There is no waste disposal of soil or groundwater.
- Data are digitized.
- The Dart sampler provides location- and depth-specific NAPL verification and characterization.
5.3.10.4 Limitations
- Lighter end light nonaqueous phase liquids (LNAPLs) such as kerosene and gasoline do not contain high enough PAHs to transfer in a convenient (24-48 hour) time span.
- Soil matrix effects influence fluorescence results (finer grain soils slow the transfer rate).
- Limits of detection decrease with porosity (grain size).
- Units of fluorescence intensity (%RE) cannot be directly converted to concentration levels unless a calibration study is conducted of site-specific NAPL on site-specific sediment.
5.3.11 Fossil Fuel (CO2) Traps
5.3.11.1 Description and Application
Fossil fuel traps (also known as CO2 traps) (Figure 5-50) are at-grade passive samplers that measure time-integrated CO₂ fluxes through the surface at petroleum-contaminated sites. CO2 traps are patented canisters that contain a strongly basic solid-state sorbent material, which converts the CO2 that passes through to stable carbonates that are retained in the trap. In addition, the traps are designed to allow for a “built-in” location-specific background correction. The CO2 flux rates are then used to determine the rate of naturally occurring biodegradation of LNAPL, or natural source zone depletion (NSZD) rates. The traps provide a method for the comparison of natural LNAPL losses (NSZD) to losses from active remedies.
The CO₂ traps have two layers of sorbent. The first layer, at the top, captures ambient CO₂, which eliminates ambient interference in the bottom sorbent. The second sorbent layer is at the bottom and absorbs CO₂ released from the soil. Because the fossil fuel trap is open to the atmosphere and the CO₂ is captured by the sorbent and does not build up within the head space, the gas flow is not disturbed, and the diffusion gradient is not altered ( [ZDQLIJLI] E-Flux – Passive Gas Sampling-Based Measurement of Natural Soil Contaminant Degradation (NSZD). n.d. “Fossil Fuel Traps (CO2 Traps) – a Passive Soil Gas Sampling Method.” Accessed February 12, 2024. https://www.soilgasflux.com/co2-traps/the-science. ). Consequently, gas flow and the diffusion gradient are unaffected. In some contexts, modern CO₂ contributions (that is, from natural soil respiration processes) can be significant, requiring consideration for estimating an accurate biodegradation rate. Under these conditions, the modern CO₂ contributions would be subtracted from the net CO₂ flux measurement ( [ZDQLIJLI] E-Flux – Passive Gas Sampling-Based Measurement of Natural Soil Contaminant Degradation (NSZD). n.d. “Fossil Fuel Traps (CO2 Traps) – a Passive Soil Gas Sampling Method.” Accessed February 12, 2024. https://www.soilgasflux.com/co2-traps/the-science. ). However, to eliminate this modern carbon interference, every bottom layer of the sorbent is precisely analyzed for its radiocarbon (¹⁴C) content (ASTM D6866-18) ( [ZDQLIJLI] E-Flux – Passive Gas Sampling-Based Measurement of Natural Soil Contaminant Degradation (NSZD). n.d. “Fossil Fuel Traps (CO2 Traps) – a Passive Soil Gas Sampling Method.” Accessed February 12, 2024. https://www.soilgasflux.com/co2-traps/the-science. ).
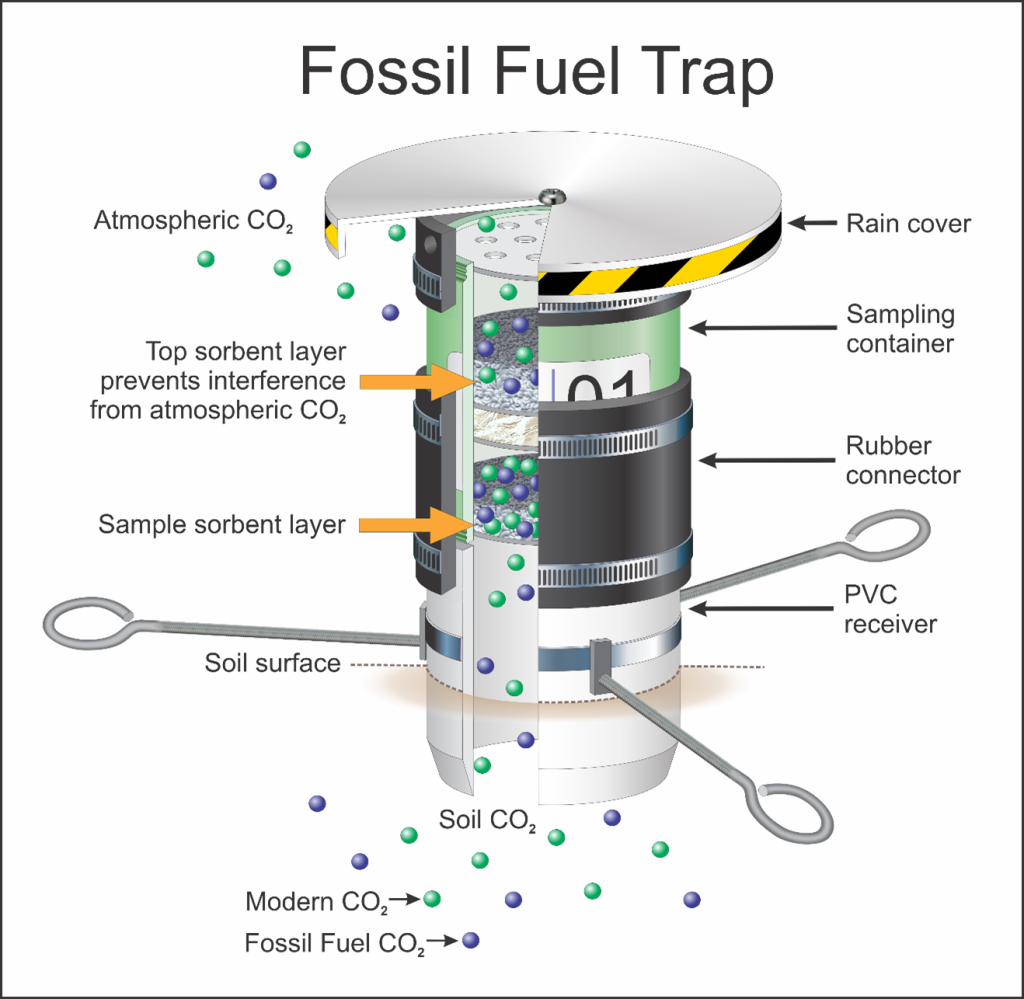
Figure 5-50. Fossil fuel trap sampler.
Source: NJDEP, used with permission.
5.3.11.2 Installation and Use
The use of a CO2 trap requires installation of a PVC collar provided with the trap inserted several inches into the ground with the trap placed on top. Anchors and a rain hood are then added to secure the trap and protect it from the elements. The standard deployment time for fossil fuel traps is 14 days (although this time frame can be modified within a range of 5–28 days without further modification of the traps) ( [ZDQLIJLI] E-Flux – Passive Gas Sampling-Based Measurement of Natural Soil Contaminant Degradation (NSZD). n.d. “Fossil Fuel Traps (CO2 Traps) – a Passive Soil Gas Sampling Method.” Accessed February 12, 2024. https://www.soilgasflux.com/co2-traps/the-science. ).
Following the 2-week sampling period, deployed traps and one undeployed trap (a trip blank) are collected and sent to the manufacturer’s laboratory (E-Flux, LLC, of Fort Collins, CO) for analysis of total CO2 and petrogenic CO2 via unstable isotope analysis (14C radiocarbon dating). The unstable isotope 14C is present in modern carbon sources, but due to a half-life of 5,600 years, is not present in fossil fuel carbon sources. This “built-in” location-specific background correction results in much more reliable petrogenic CO2 flux estimation than can reasonably be accomplished via other CO2 flux methods. The CO2 flux is then converted to a depletion rate by multiplying by an appropriate stoichiometric ratio, which describes the mass relationship between CO2 and the specific LNAPL compound of interest. Measuring the total CO₂ flux over an extended period gives a time-integrated estimate of the soil CO2 flux. This extended period also accounts for temporal variability including atmospheric pressure fluctuations and weather changes.
5.3.11.3 Advantages
- CO2 traps do not require power, so they can be deployed in remote locations.
- They are easy to use and can be installed by local site personnel without specialized training.
- They can produce time-integrated average flux measurements, accounting for diurnal and daily fluctuations.
- They can be used for ¹⁴C analysis to differentiate fossil fuel-generated CO₂ from modern CO₂ interference, providing location-specific background correction ( [ZDQLIJLI] E-Flux – Passive Gas Sampling-Based Measurement of Natural Soil Contaminant Degradation (NSZD). n.d. “Fossil Fuel Traps (CO2 Traps) – a Passive Soil Gas Sampling Method.” Accessed February 12, 2024. https://www.soilgasflux.com/co2-traps/the-science. ).
5.3.11.4 Limitations
- CO2 traps cannot be used in areas with impermeable surface cover that limits atmospheric-soil gas exchange (for example, asphalt, concrete, or other liners).
- Saturated soil (due to recent high precipitation events) can hinder CO2 mobility to the surface, thus biasing the results from this method low.
- Their use may not be valid at sites where 14C-enriched chemicals have been used or sites in the vicinity of nuclear reactors or waste.
- They have a higher cost than other CO2 flux methods, which may limit the number of traps used at a site.
5.3.12 Bio-Trap Sampler
5.3.12.1 Description and Application
Bio-Trap samplers (Figure 5-51) are passive samplers that collect microbes over time to better understand biodegradation potential ( [YKRJK3FC] “Bio-Trap Samplers.” n.d. Microbial Insights. Accessed February 13, 2024. https://microbe.com/bio-trap-samplers/. ). BACTRAPS are another activated carbon-based sampler available for use. For the Bio-Trap, Bio-Sep beads, a unique sampling matrix, are key to the approach. The beads are 2–3 mm in diameter and are constructed from a composite of Nomex and powdered activated carbon ( [YKRJK3FC] “Bio-Trap Samplers.” n.d. Microbial Insights. Accessed February 13, 2024. https://microbe.com/bio-trap-samplers/. ).
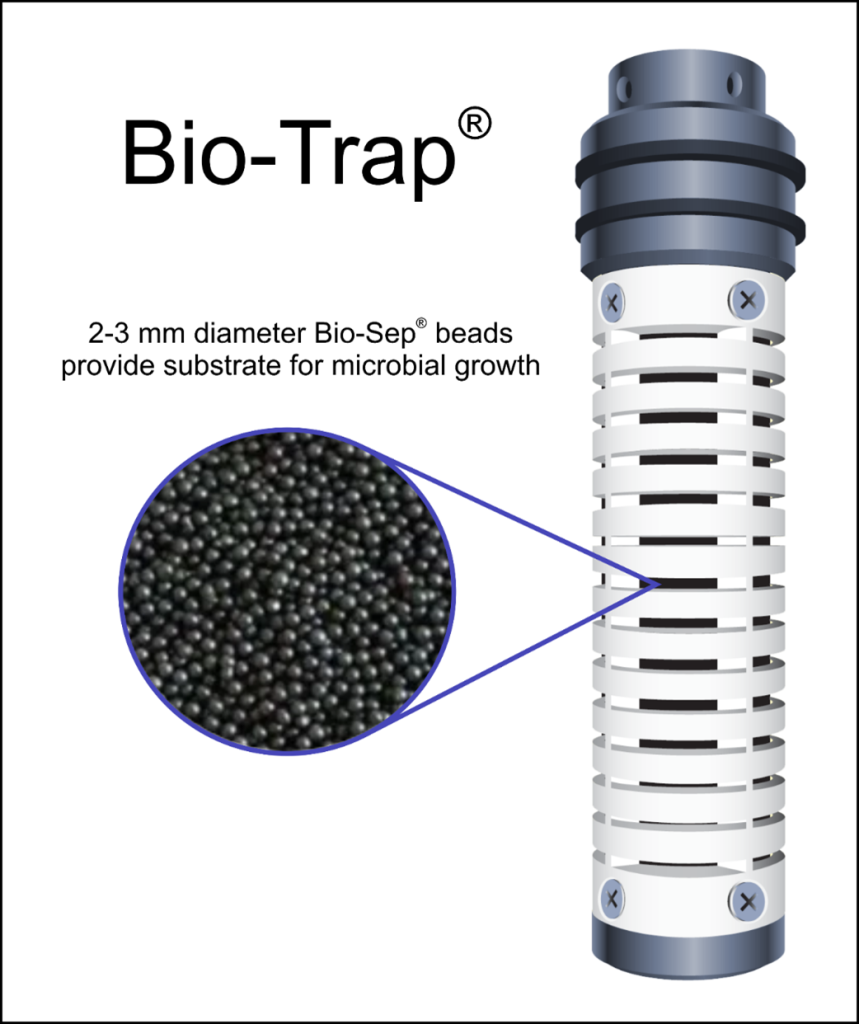
Figure 5-51. Bio-Trap sampler.
Source: NJDEP, used with permission.
5.3.12.2 Installation and Use
Once deployed in a monitoring well, the beads adsorb chemicals and nutrients present in the aquifer. This effectively creates an in situ microcosm with an exceptionally large surface area (~600 m2/g) that is colonized by subsurface microorganisms ( [YKRJK3FC] “Bio-Trap Samplers.” n.d. Microbial Insights. Accessed February 13, 2024. https://microbe.com/bio-trap-samplers/. ).The Bio-Trap is suspended in the screened interval and left for 30–60 days, depending on study objectives, and then retrieved. Once recovered, DNA, RNA, or phospholipid-derived fatty acids (PLFA) can be extracted from the beads for qPCR, QuantArray or PLFA assays to evaluate the microbial community ( [YKRJK3FC] “Bio-Trap Samplers.” n.d. Microbial Insights. Accessed February 13, 2024. https://microbe.com/bio-trap-samplers/. ). The Bio-Trap can produce results that can be integrated over time rather than from a single sampling event ( [YKRJK3FC] “Bio-Trap Samplers.” n.d. Microbial Insights. Accessed February 13, 2024. https://microbe.com/bio-trap-samplers/. ). Numerous Bio-Trap samplers can be confined from one another using a double seal cap assembly.
5.3.12.3 Advantages
- Bio-Trap samplers provide an integrated view rather than a snapshot.
- Organisms colonize the traps in situ, selecting for active processes.
- These samplers can be analyzed with any molecular tool.
- The trap has strong adsorptive capability.
- They are versatile.
5.3.12.4 Limitations
- Organisms must actively colonize the trap, so it may miss low-concentration processes or organisms.
- Bio-Trap samplers must be left in the monitoring well for at least 30 days, so teams need two trips to the field for deployment and retrieval.